
- iOS
- 🤖 Android
- 🖥️ Website & Desktop
Progress: Good Habits
Date Range & Habit Controls
Before diving into the data, you need to set your parameters. The filtering tools are located in the top right corner of the screen.This section allows you to:- Select standard milestones (like 7, 14, 28, or 60 days, up to 6 months) or define a completely custom start and end date.
- Filter the specific habits, habits from a certain area, or habits from a specific Time of Day.
Daily Effort Overview
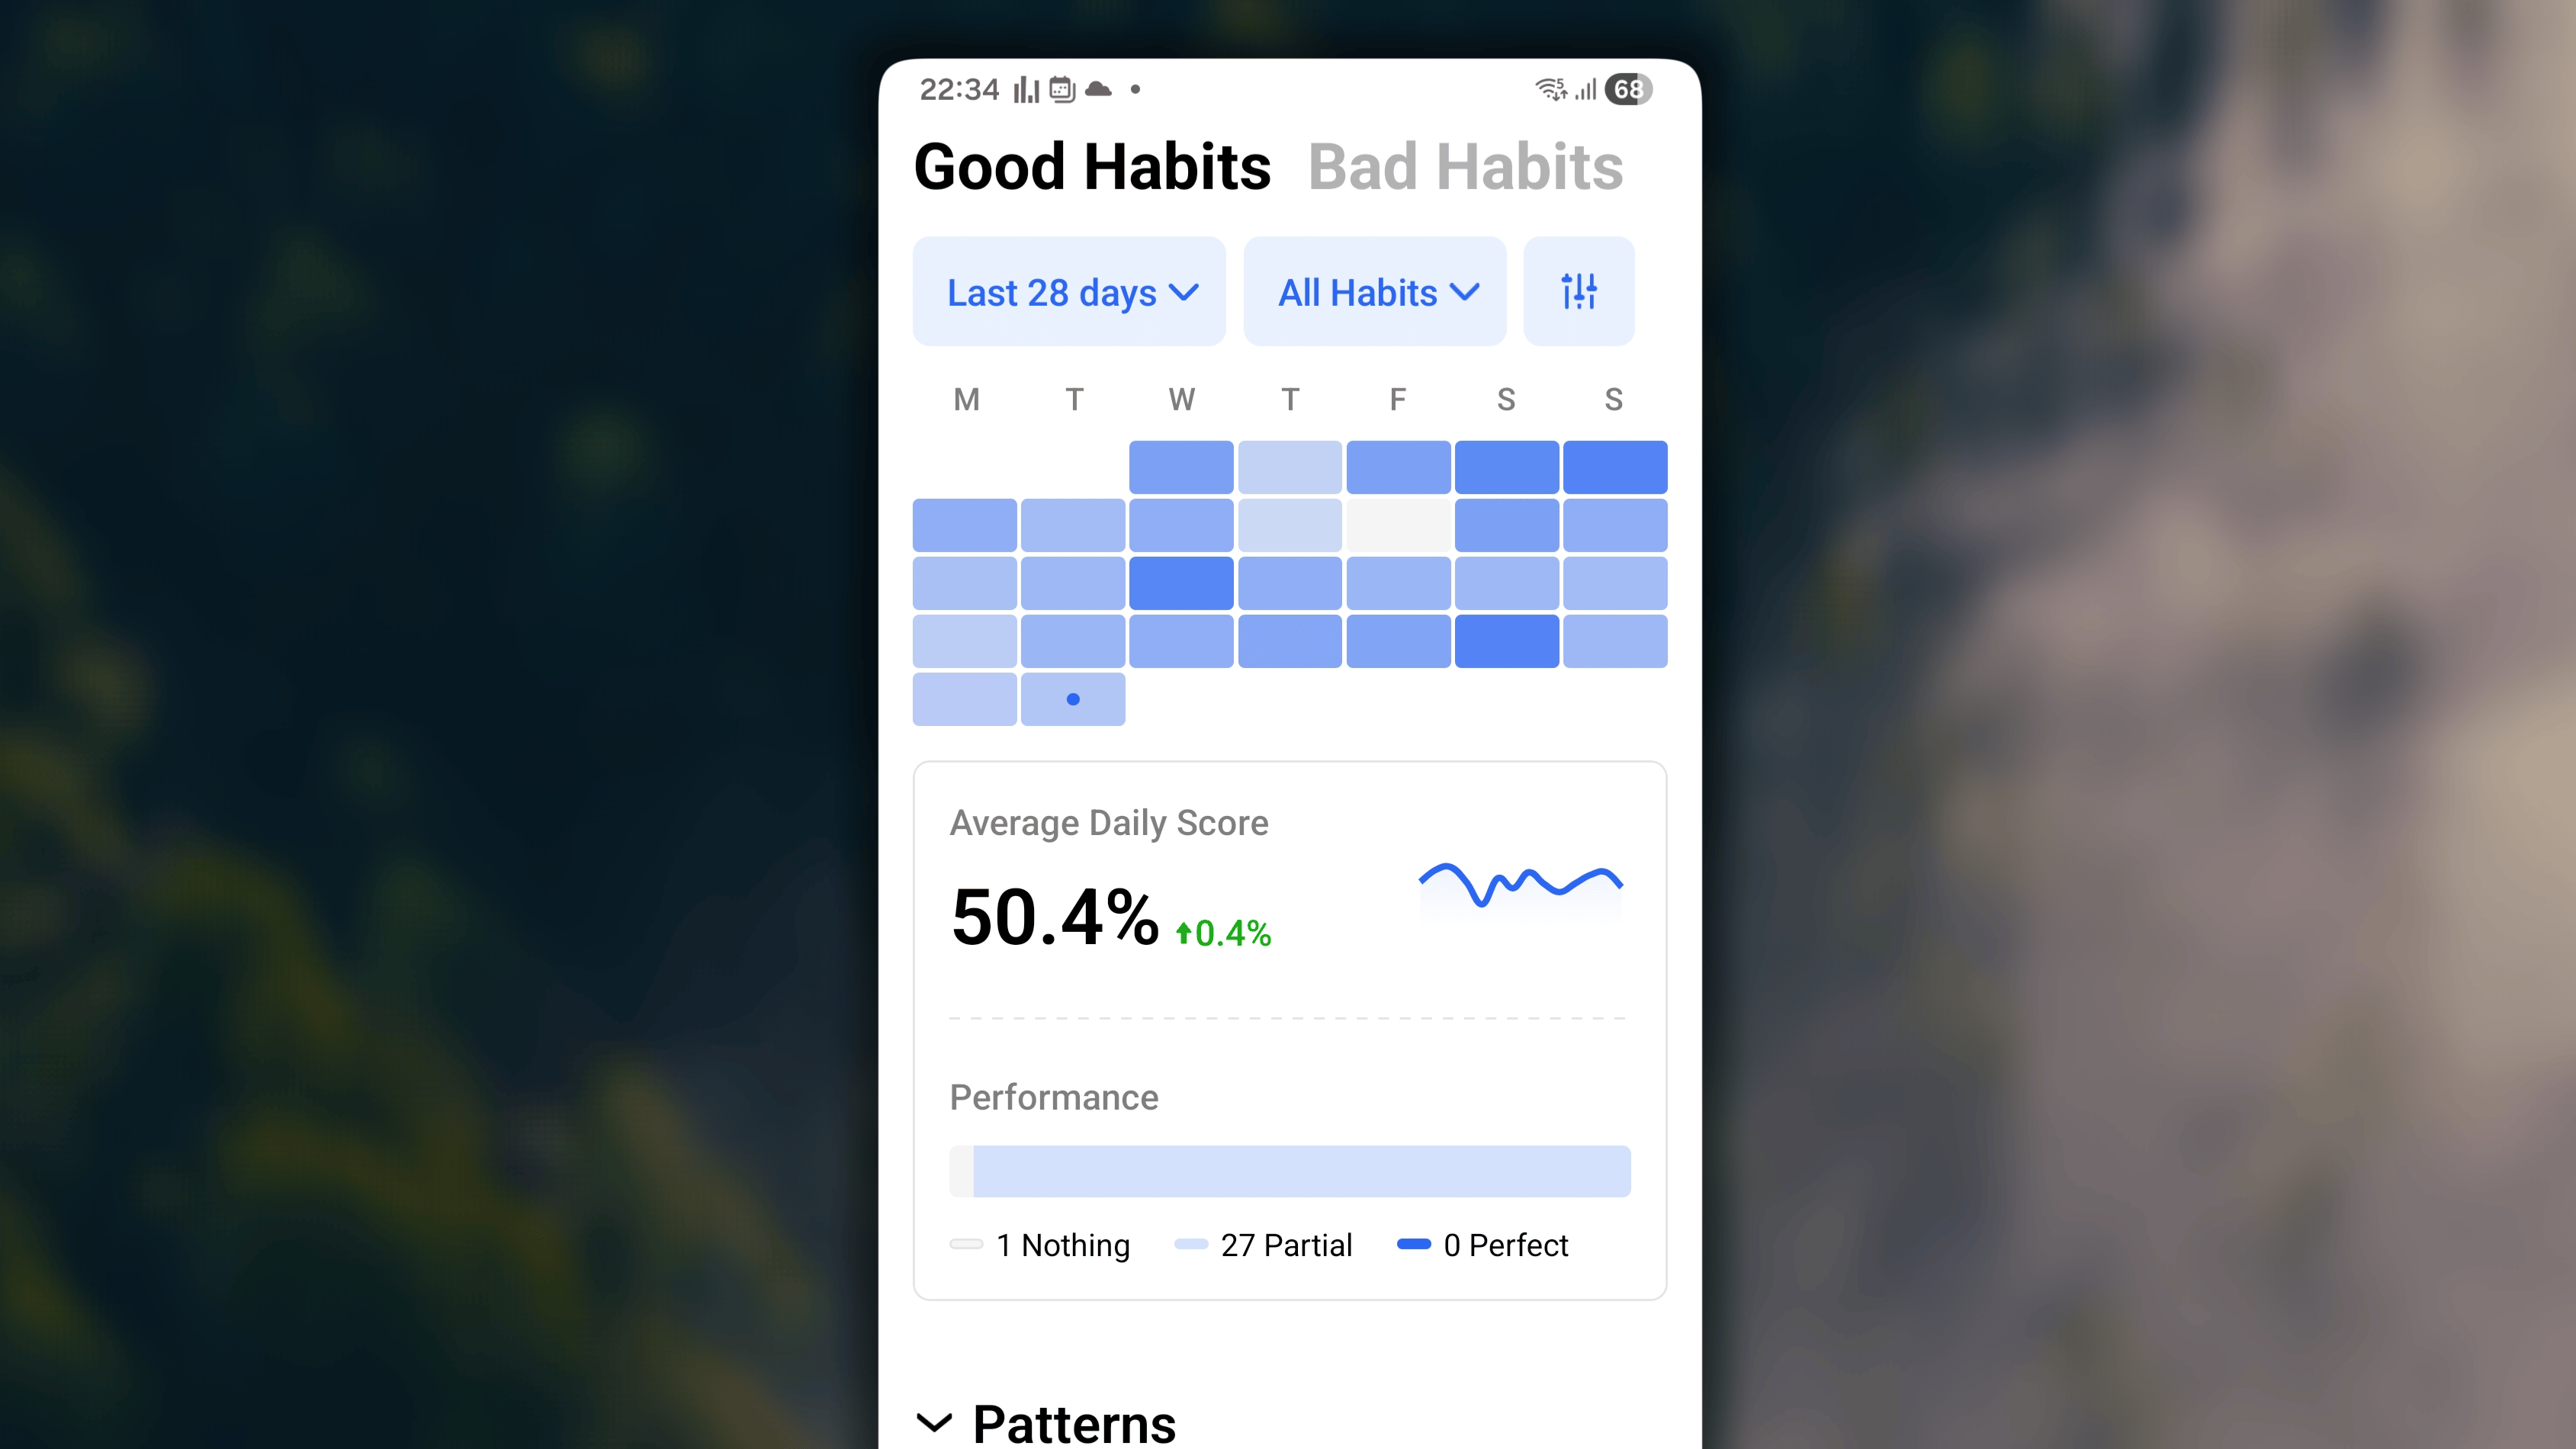
This is your entry point into Progress, built to answer one question: am I actually being consistent, or does it just feel that way?This section gives you a holistic view of the effort you are truly putting in through three key metrics: Consistency Heatmap, AVG Daily Score, and Performance Bar.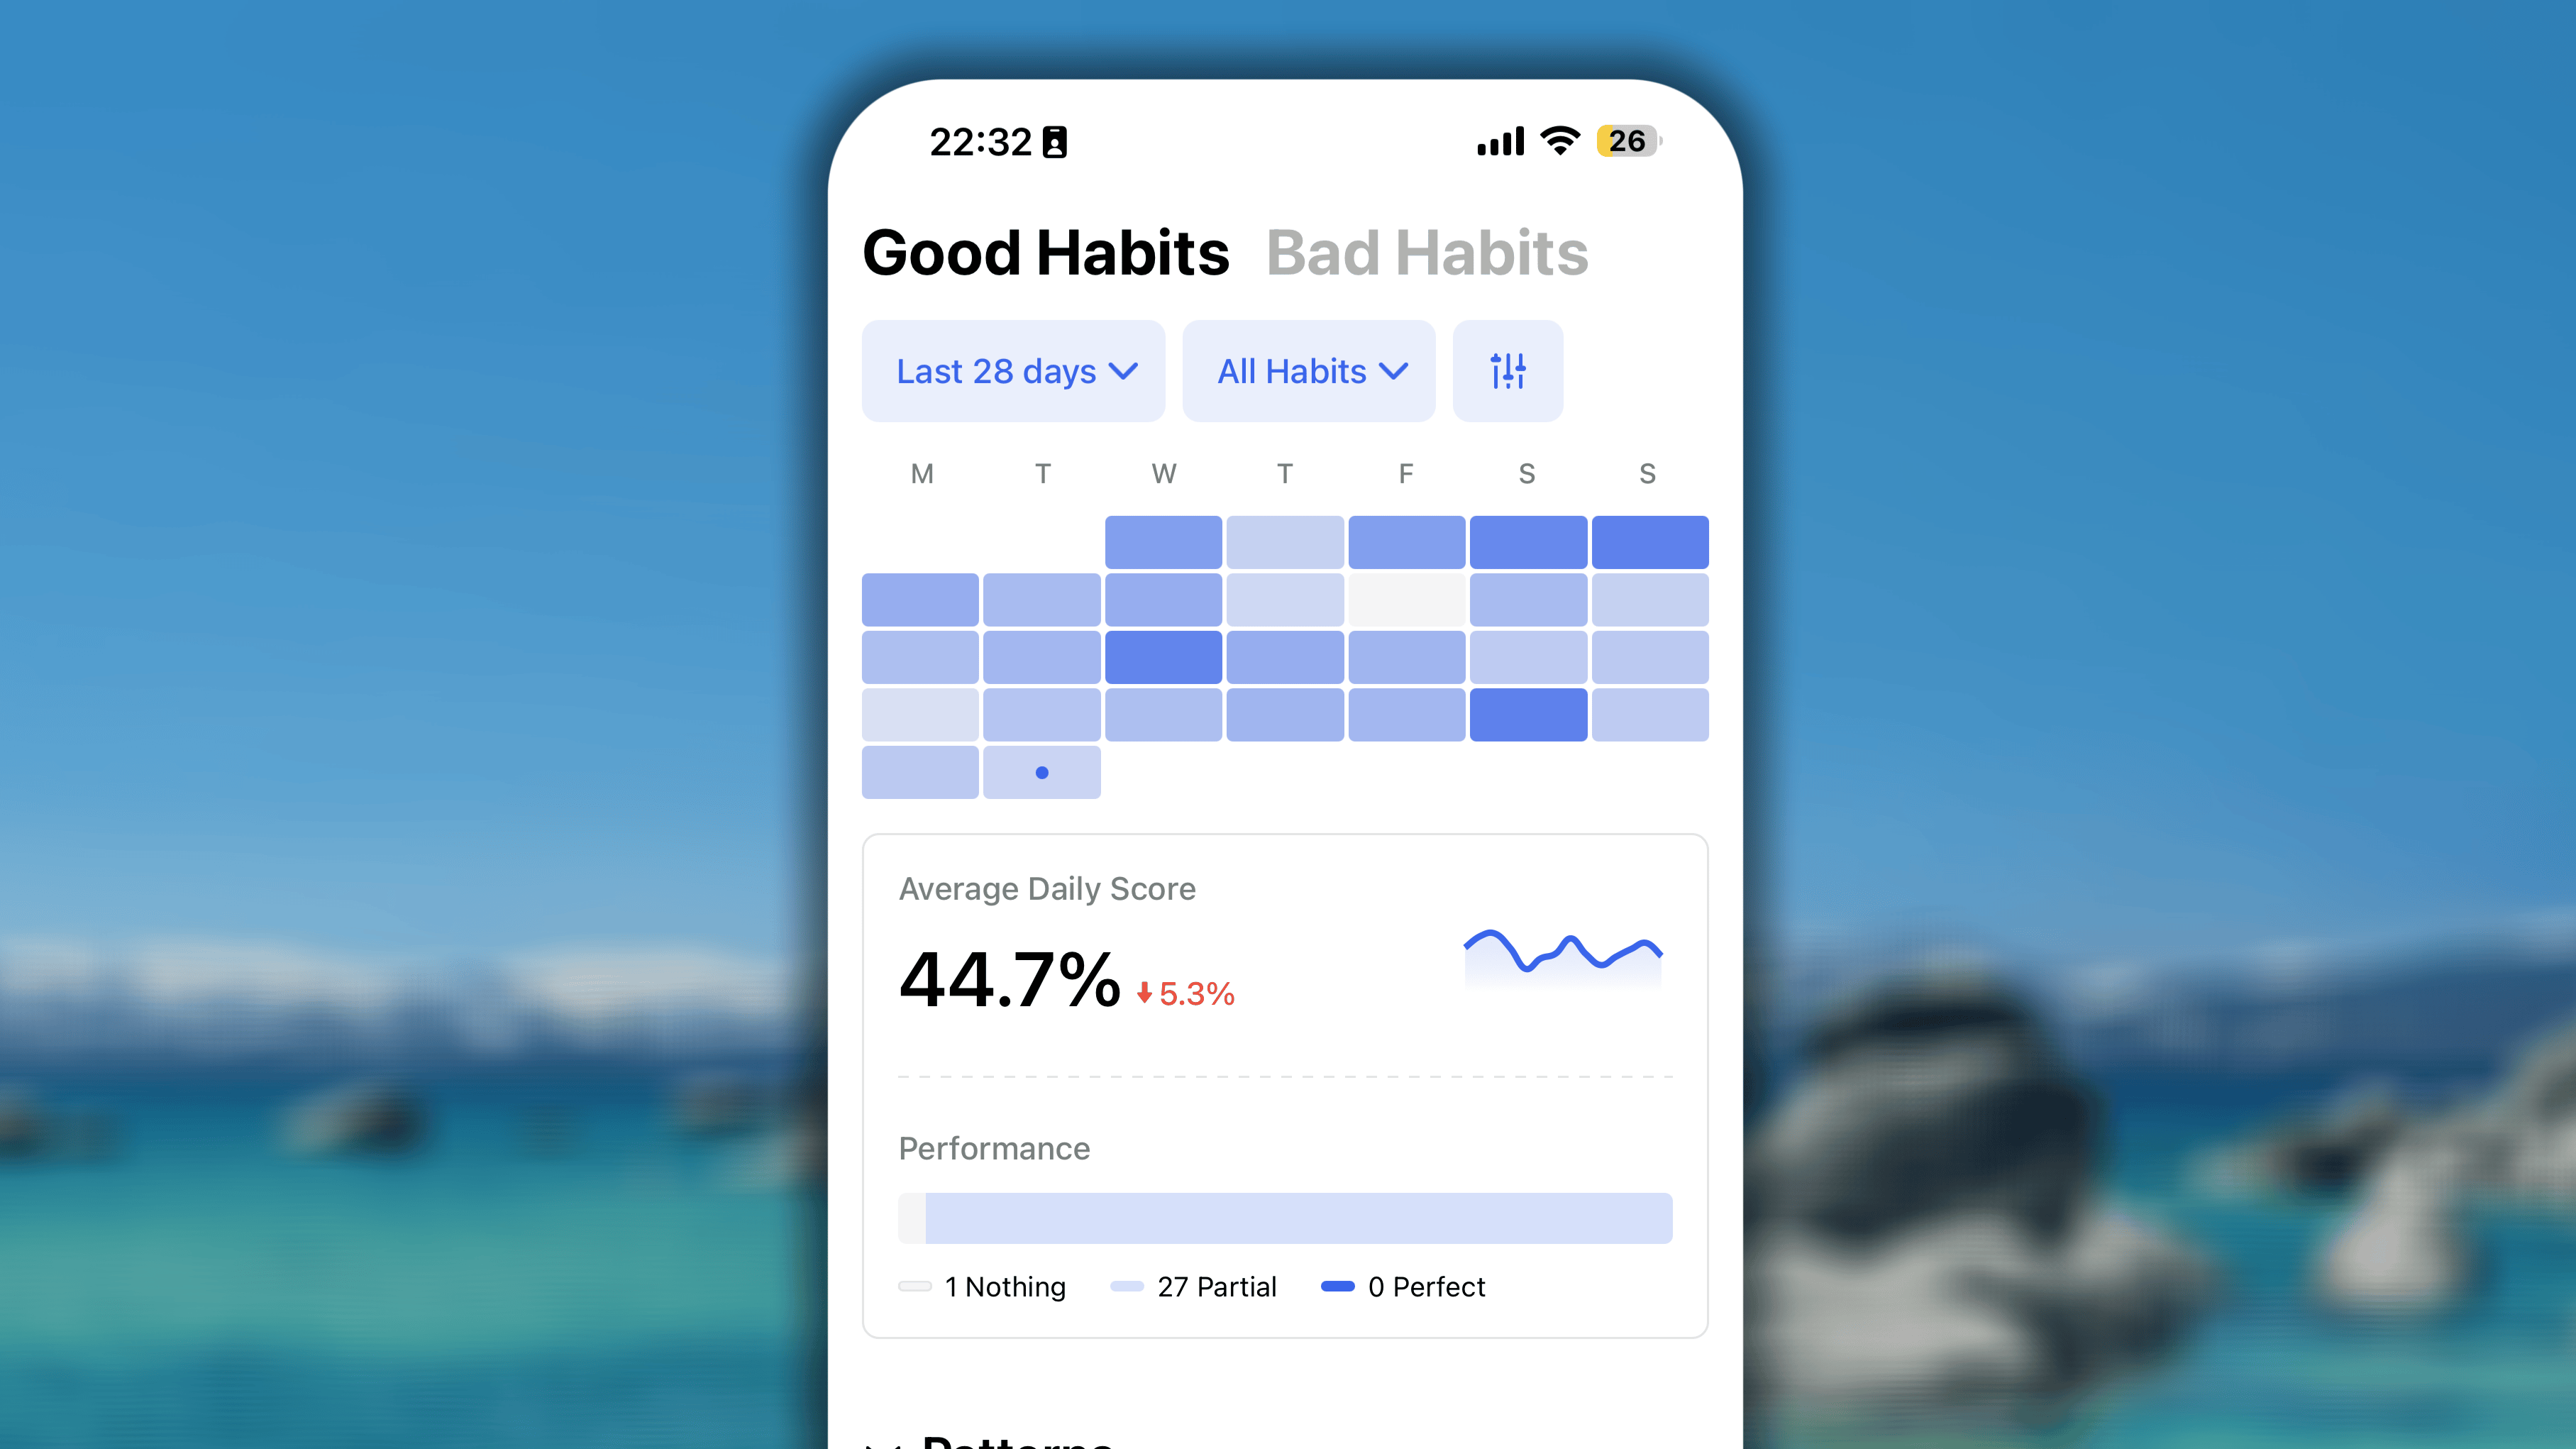
Consistency Heatmap
Located at the very top of your dashboard, the heatmap provides a vibrant, visual representation of your endurance over time.This grid consists of small squares representing your days, with the number of cells directly matching the date range you selected in your filter. The color intensity of each cell reflects your daily completion rate: the higher your completion percentage for that day, the darker and more solid the color will be.Average Daily Score
Directly below the heatmap, you will find core metrics that evaluate your overall effectiveness for the selected period, alongside a trend indicator comparing your current momentum to the past.- Average Daily Score: This represents your overall daily completion rate. The formula calculates the sum of your completion rates for each day, divided by the total number of days in your filter. (Example: If you have 3 daily habits today and complete 1, today’s completion rate is 33.3%).
- Trend Indicator: This shows the comparison between your current score and the immediate previous period. (Example: If you are viewing the “Last 7 days,” it compares your current score to the 7 days prior to that).
Performance Bar
This breaks your days down into three clear states:- Nothing: number of days with 0 daily habits completed,
- Partial: number of days with some habits completed, but not all,
- Complete: number of days with 100% of daily habits finished.
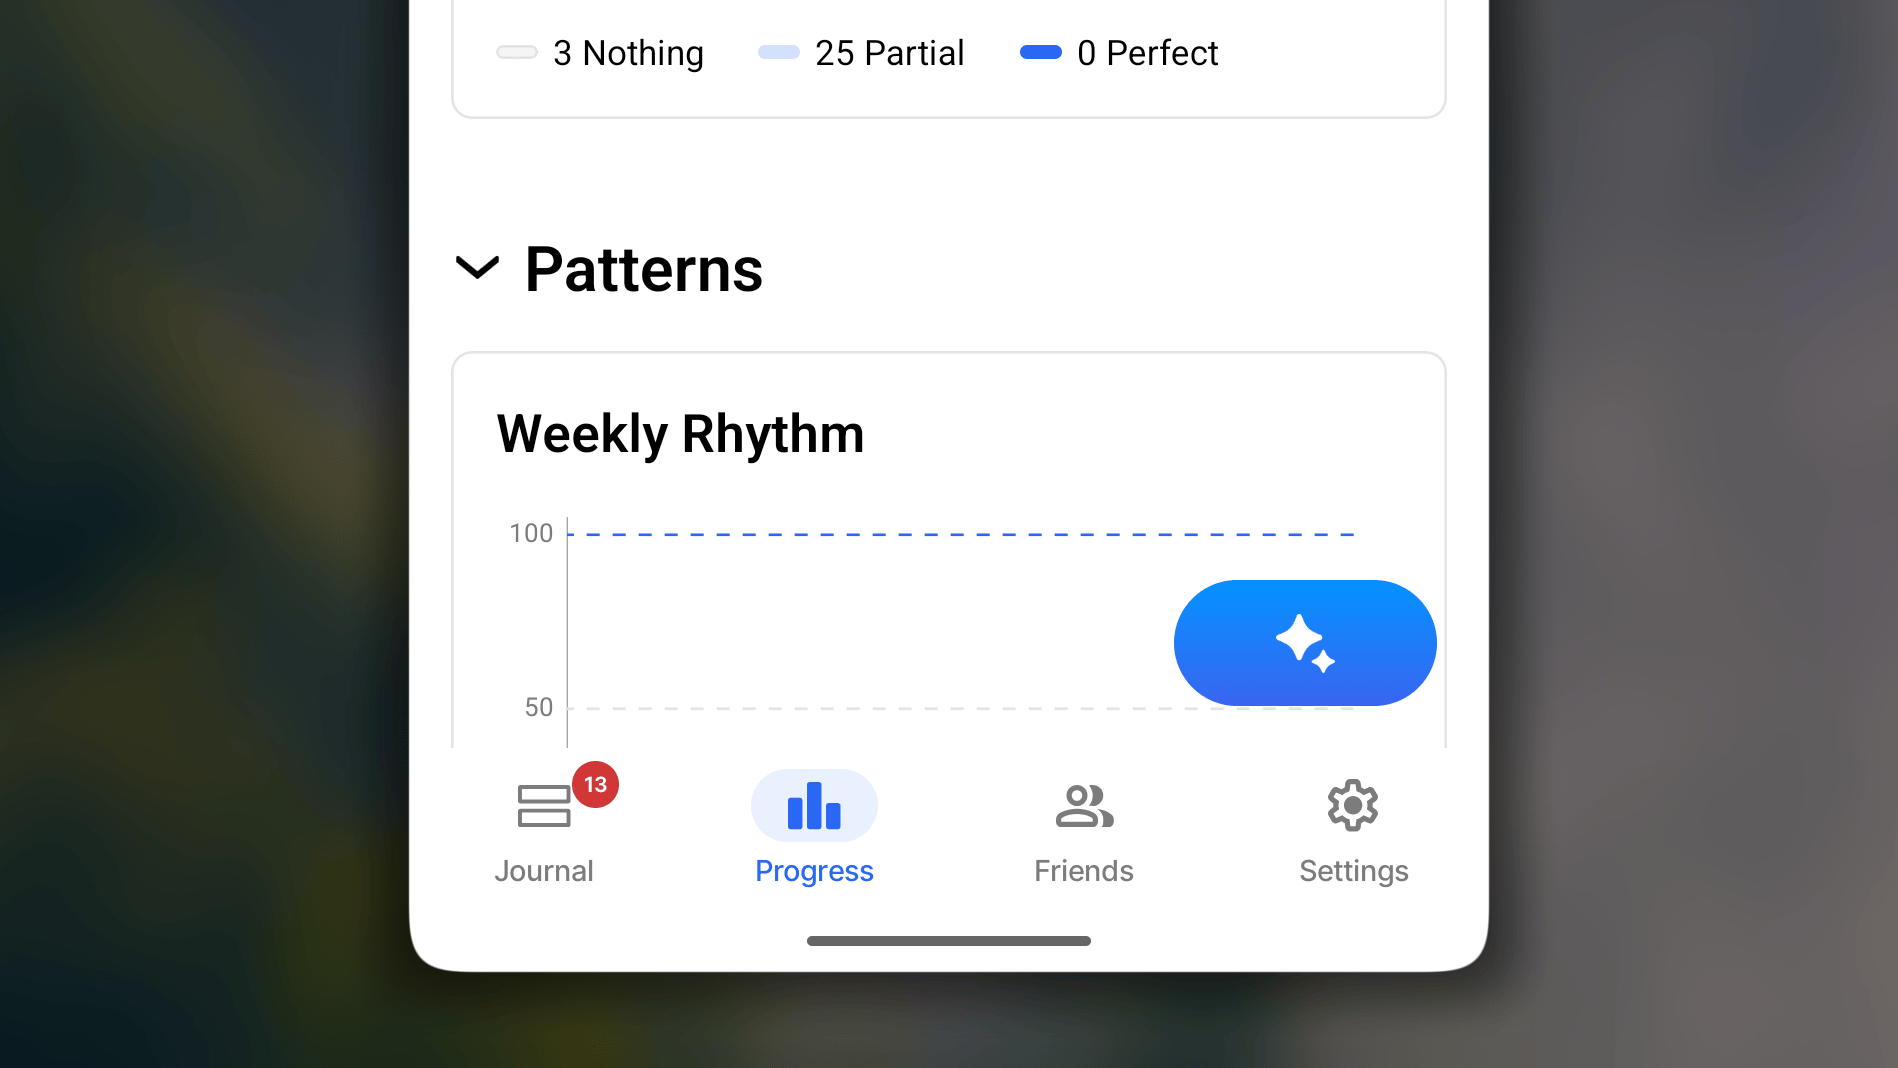
Patterns
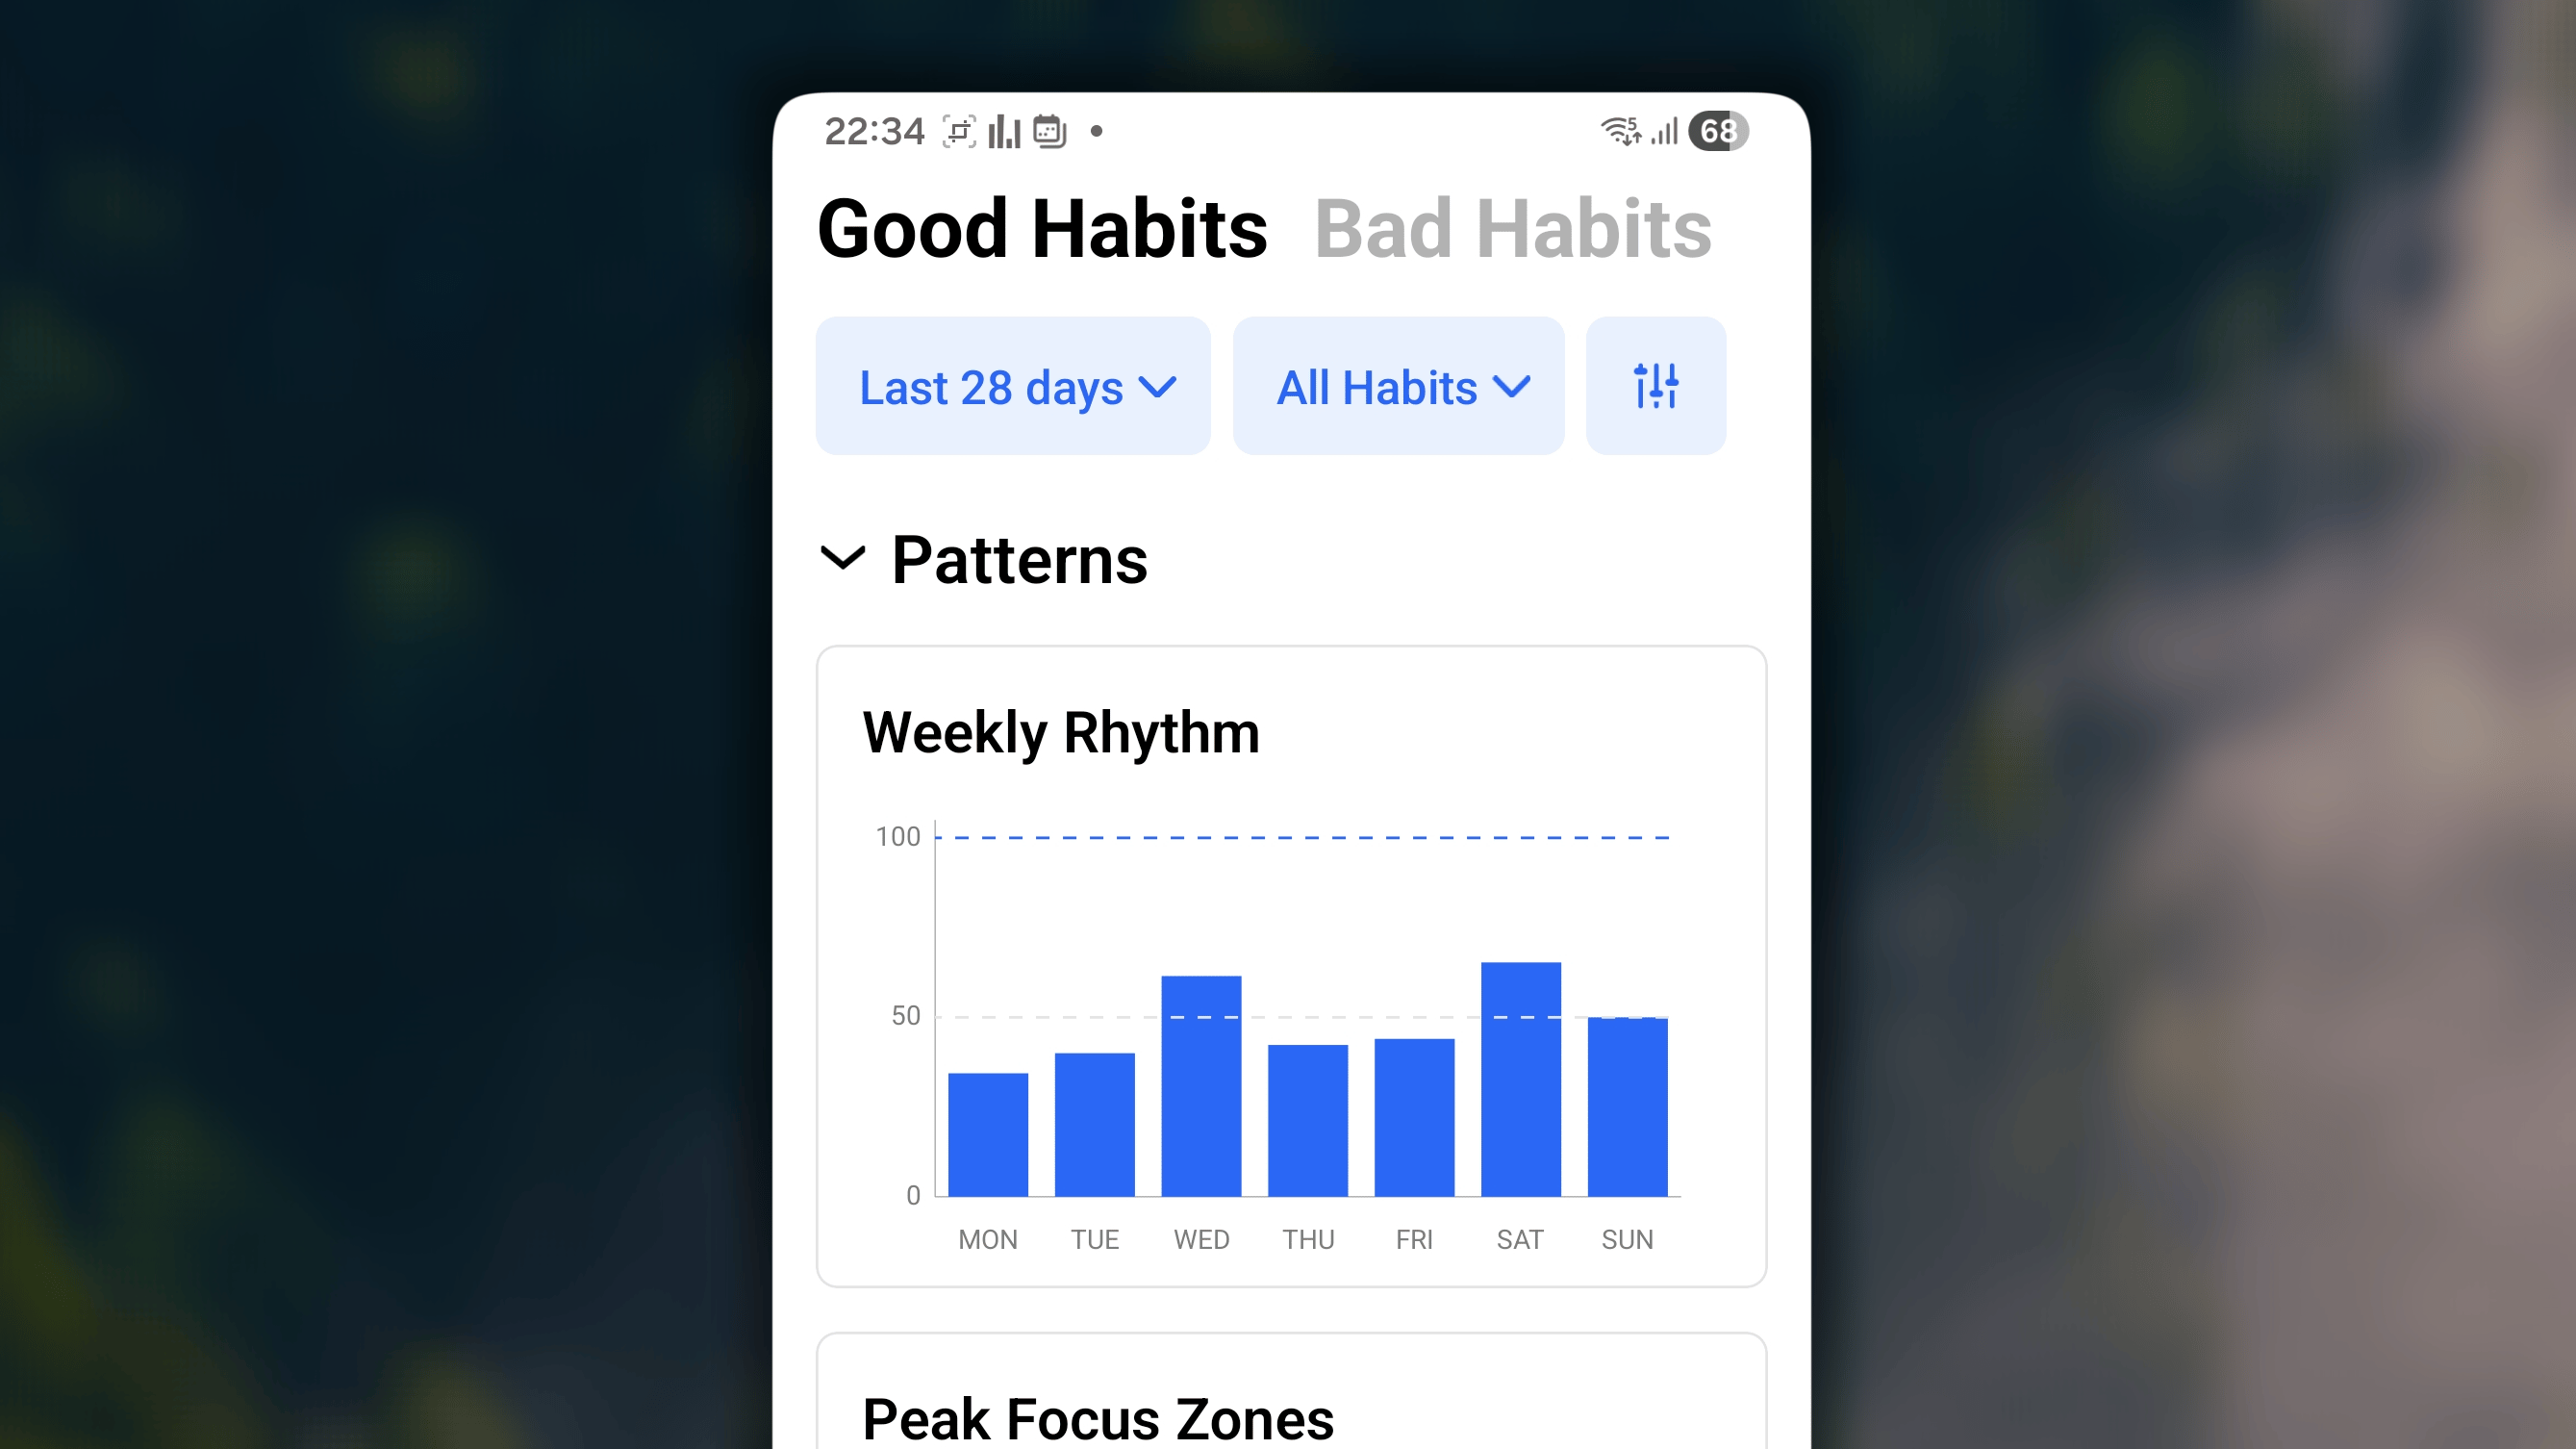
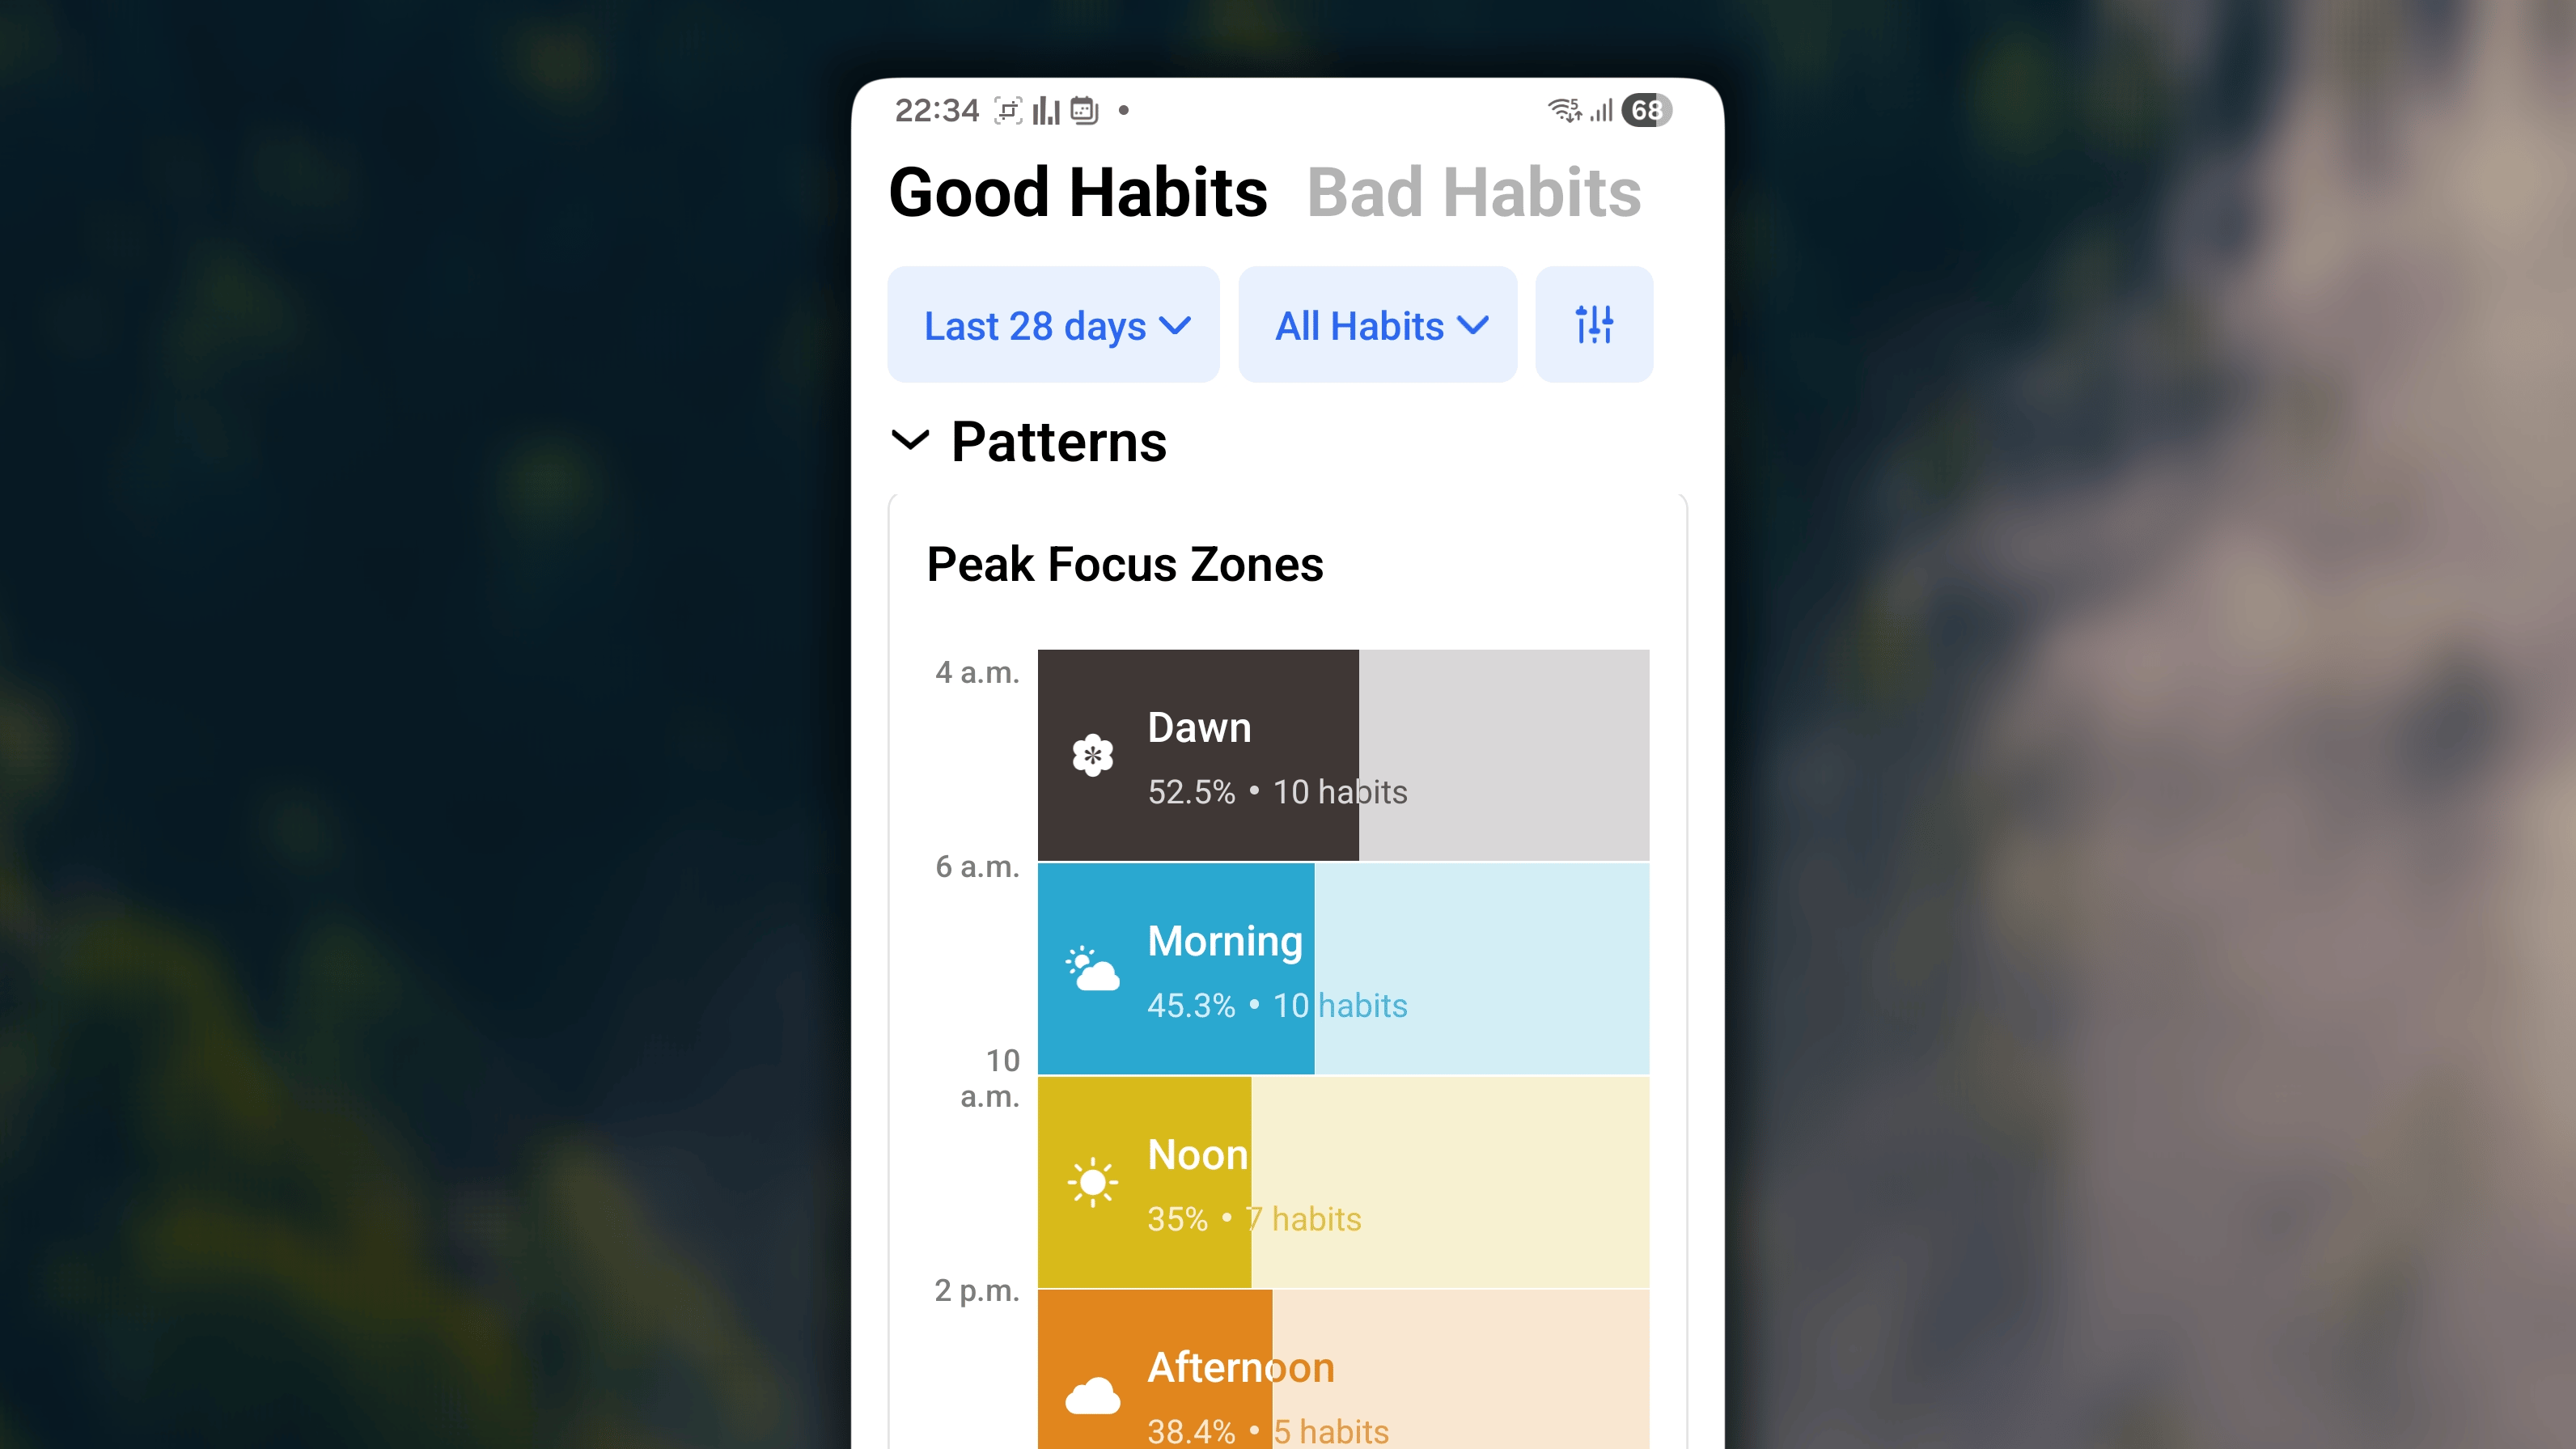
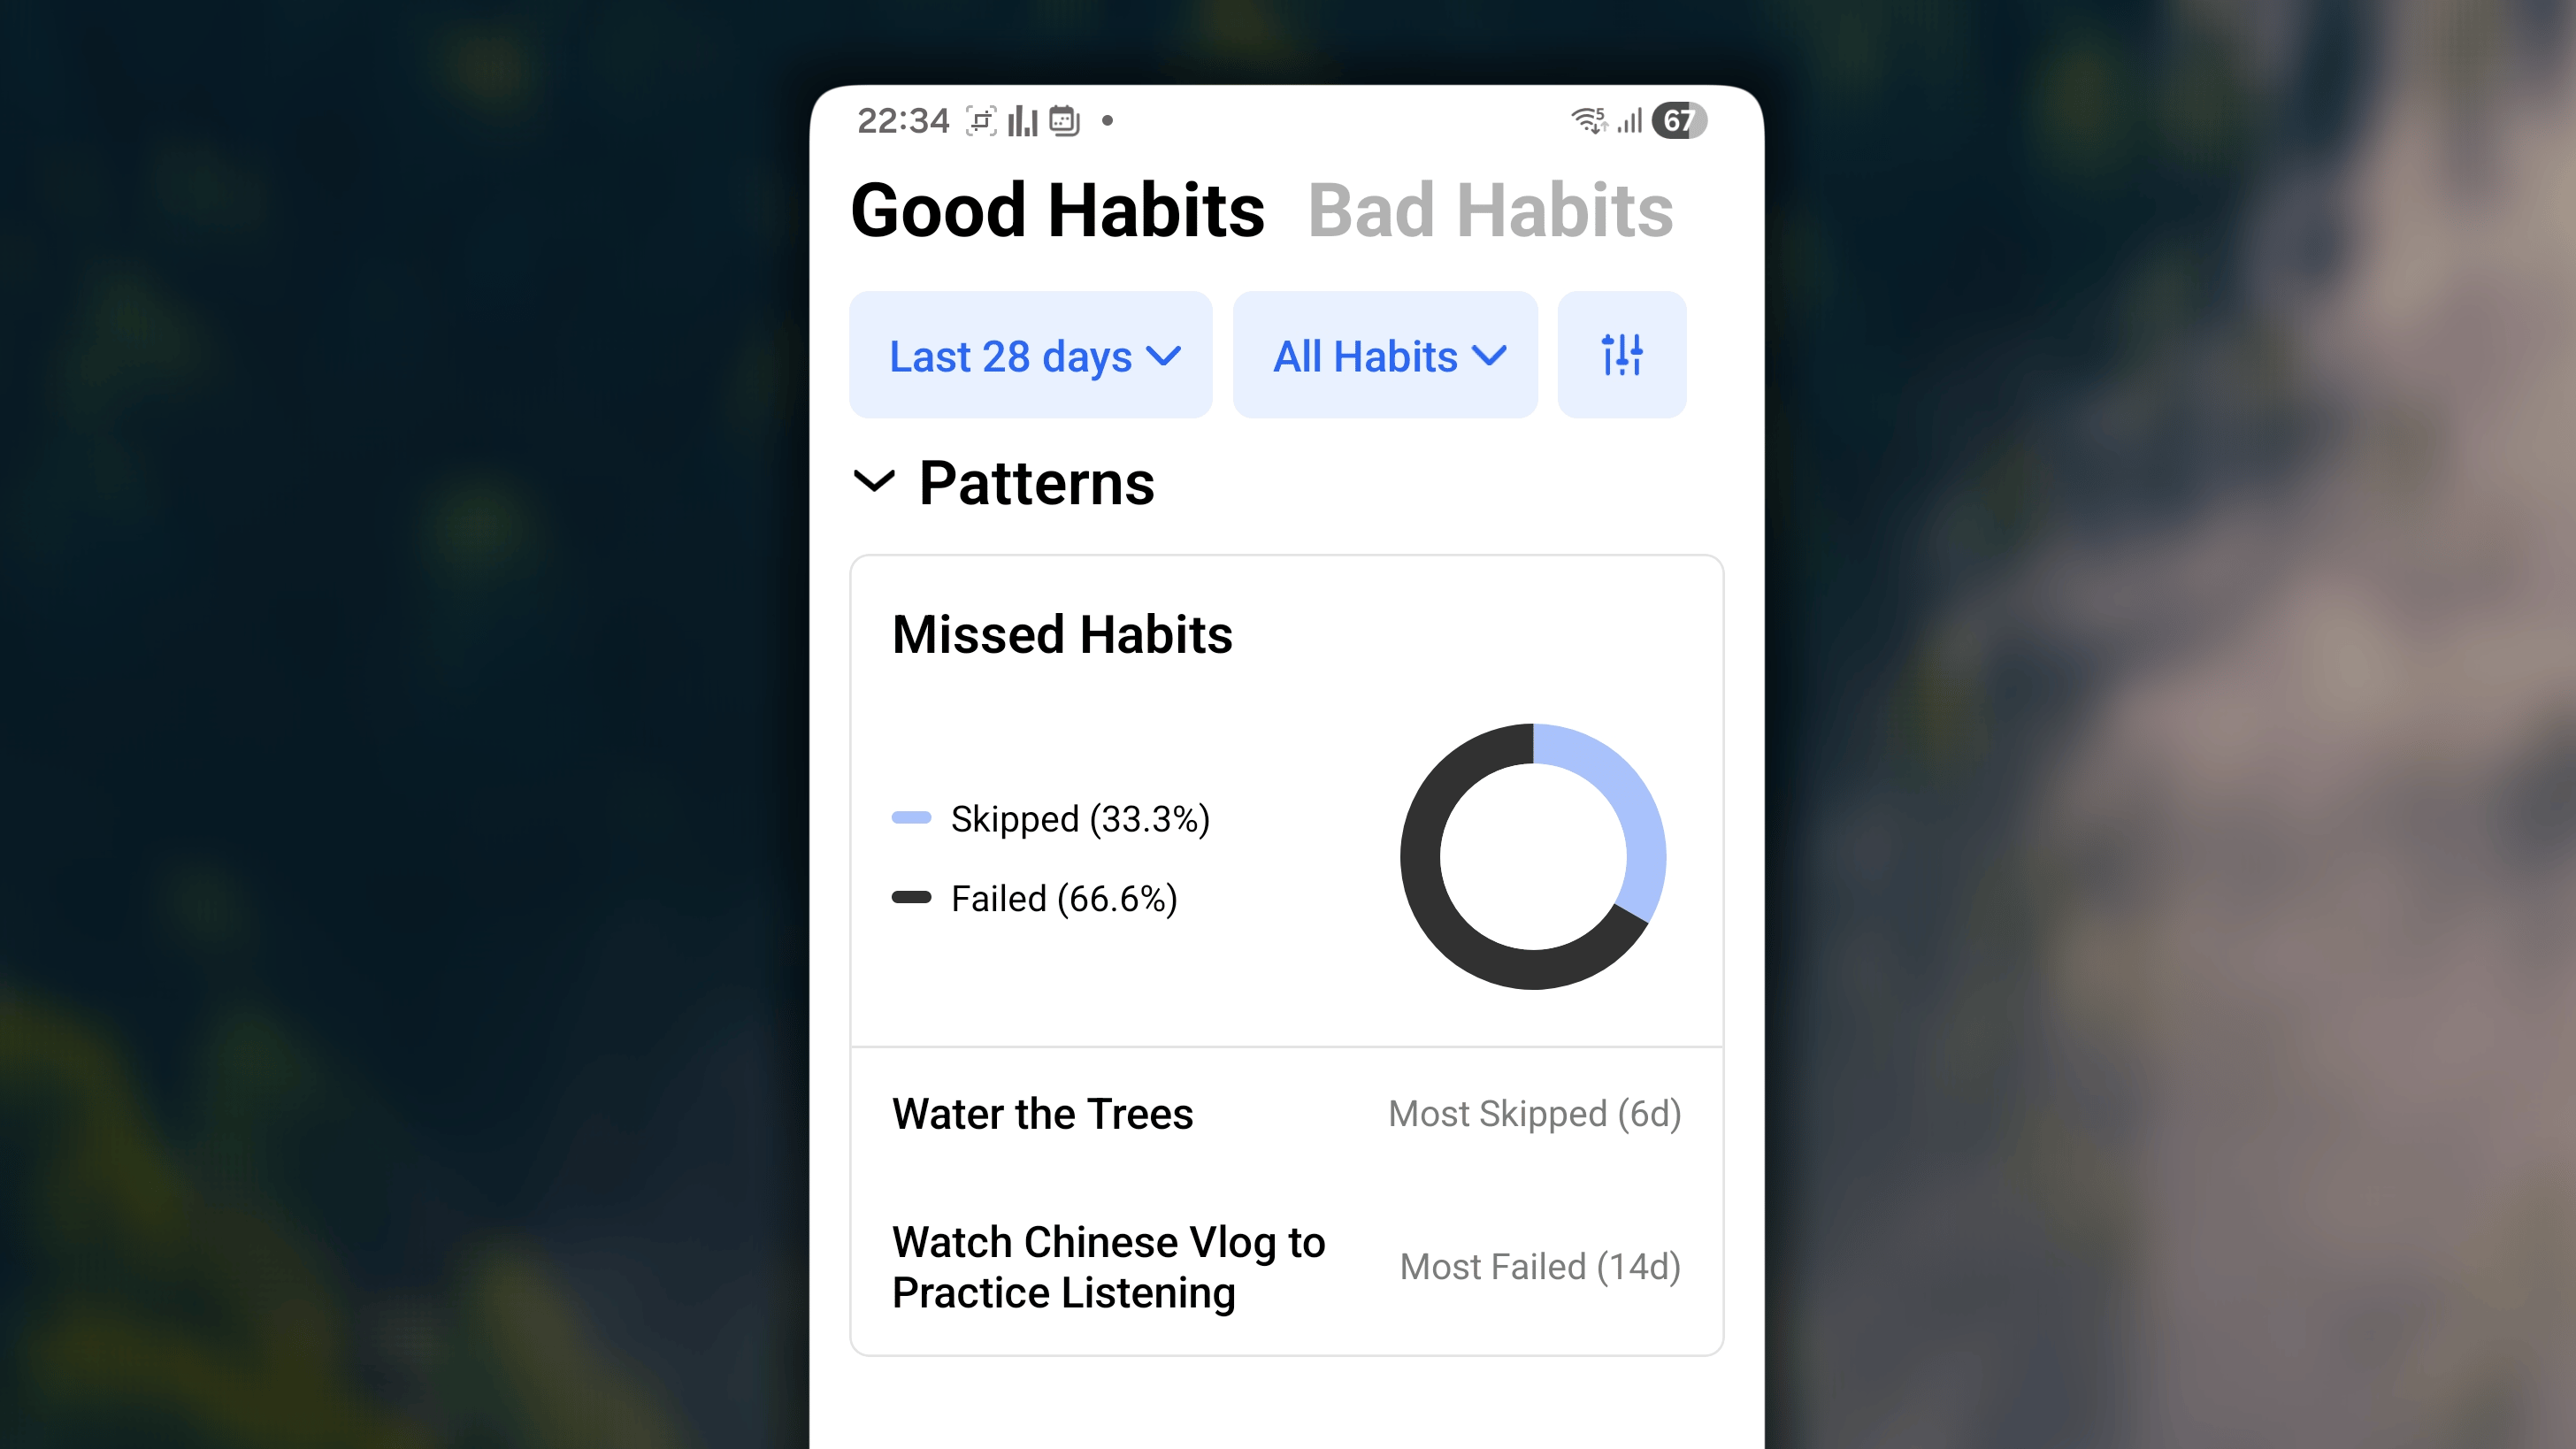
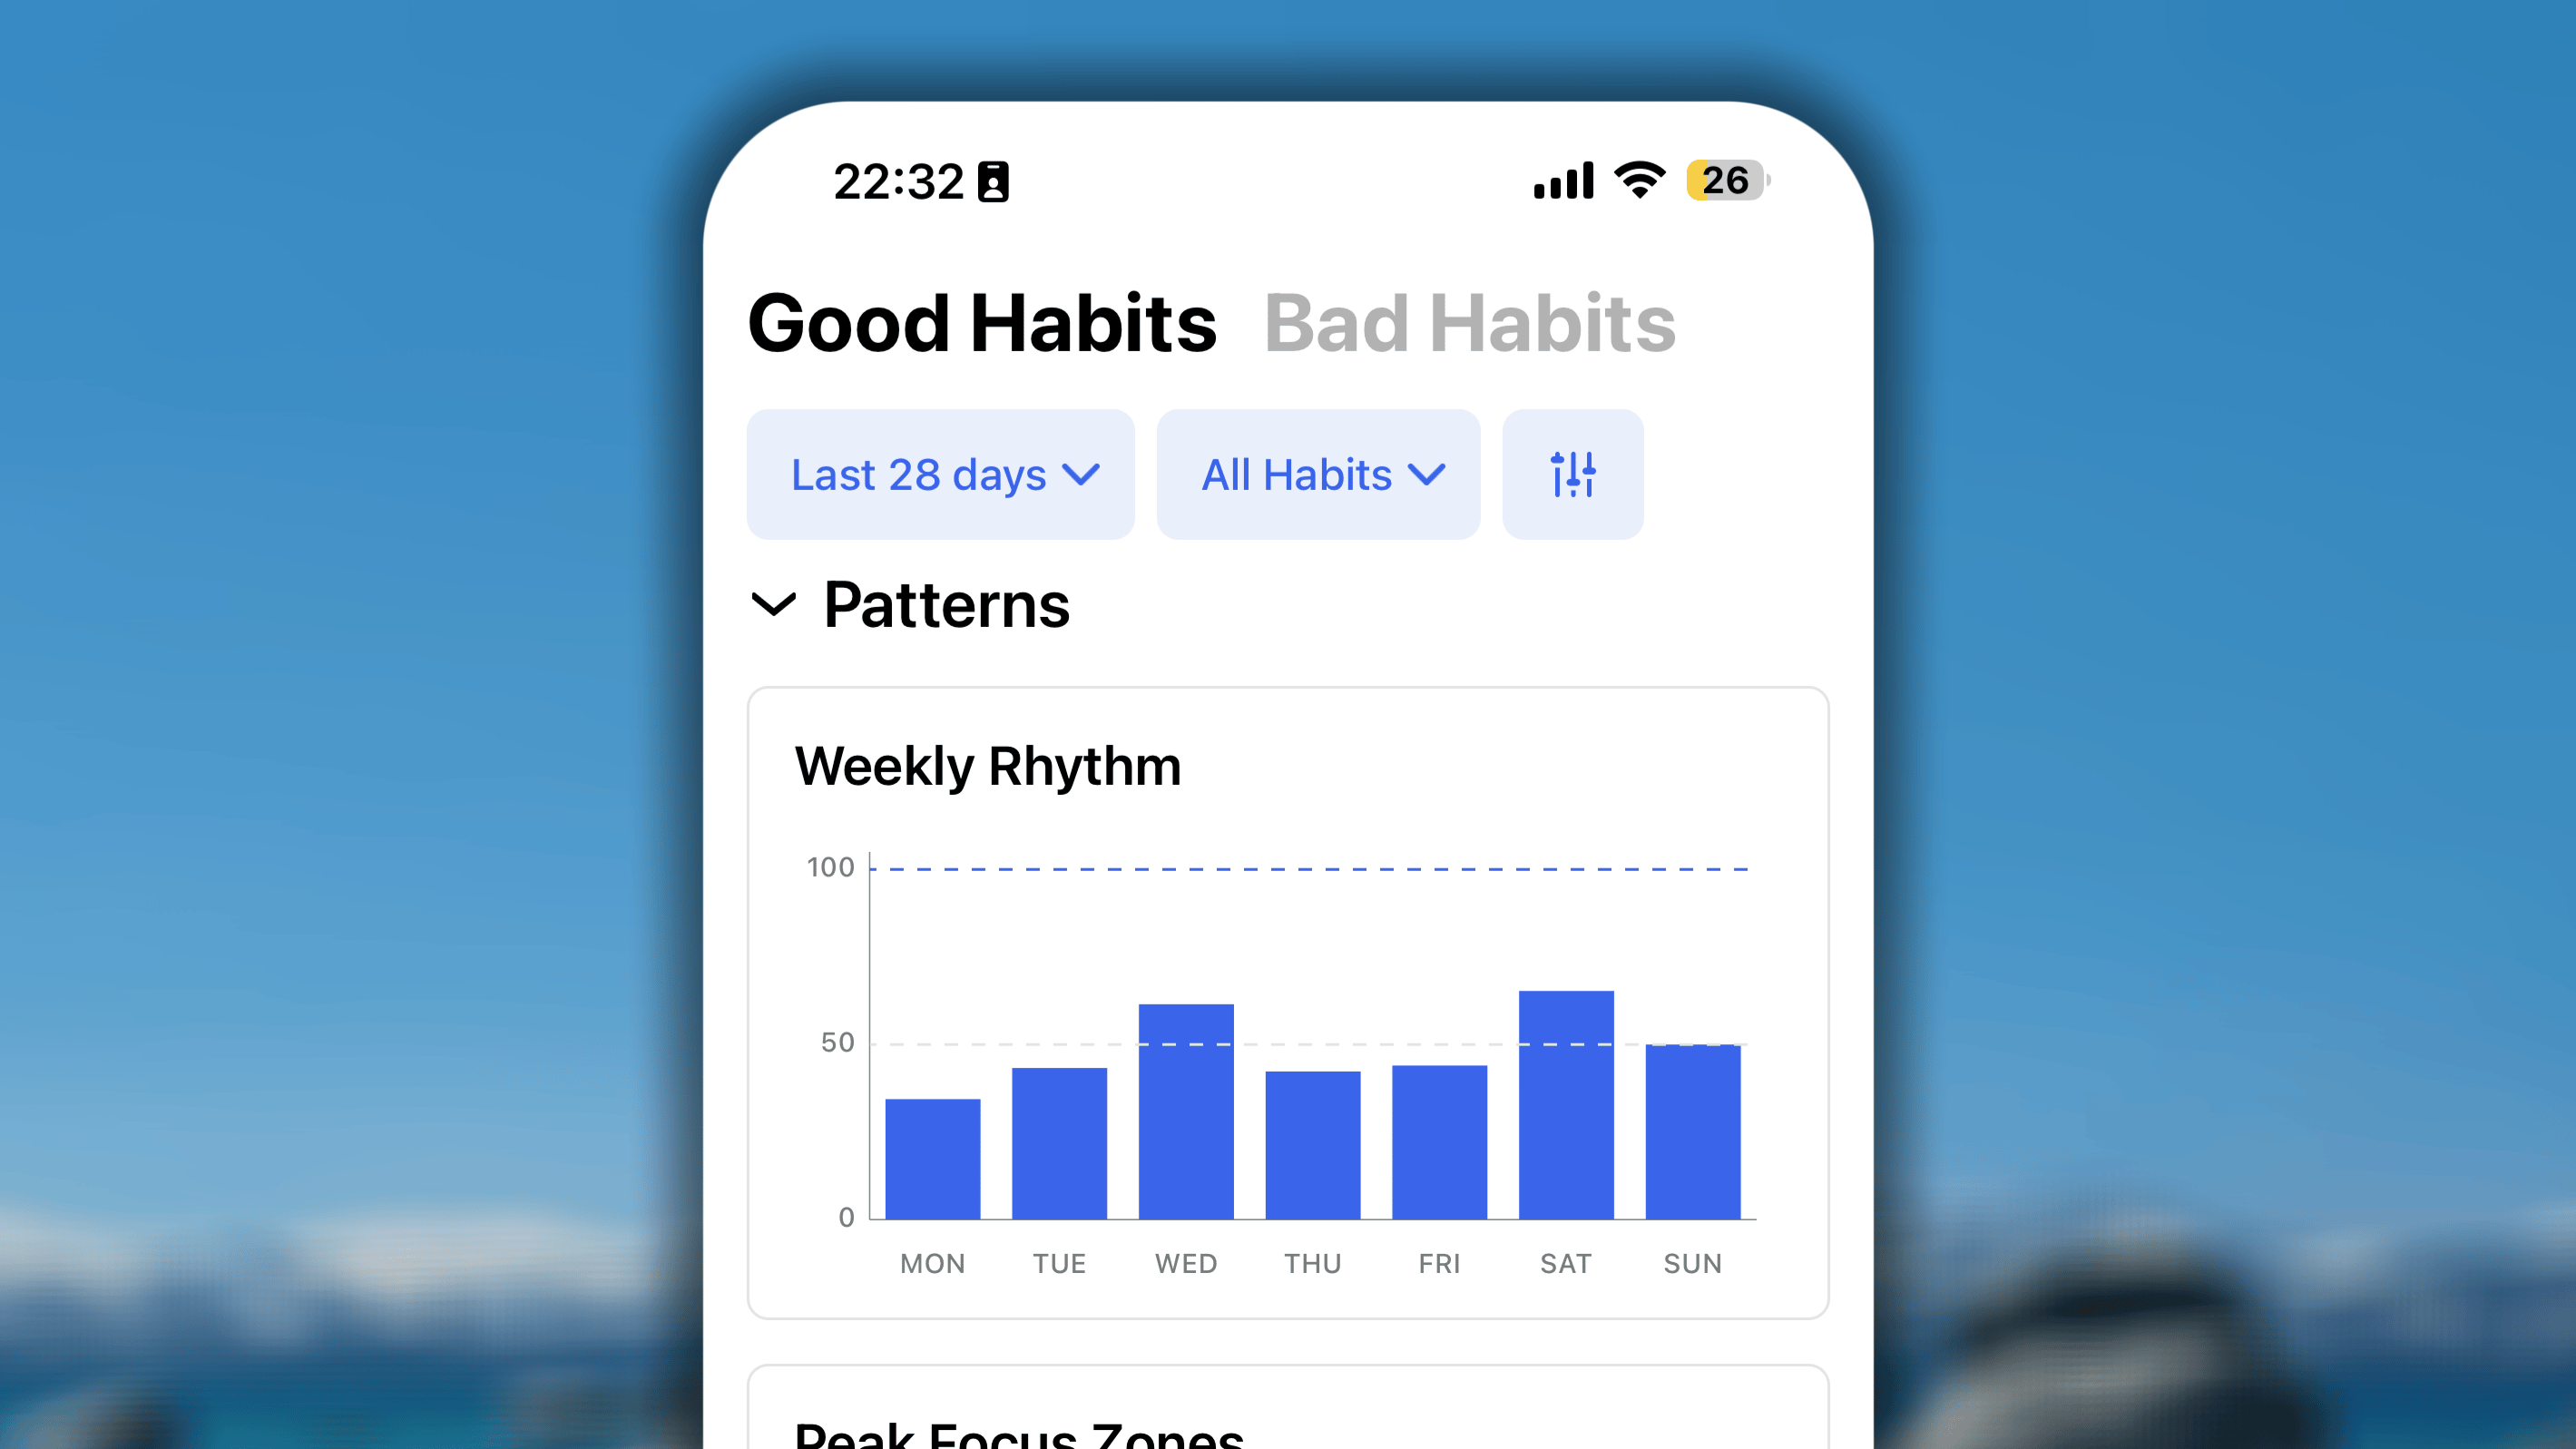
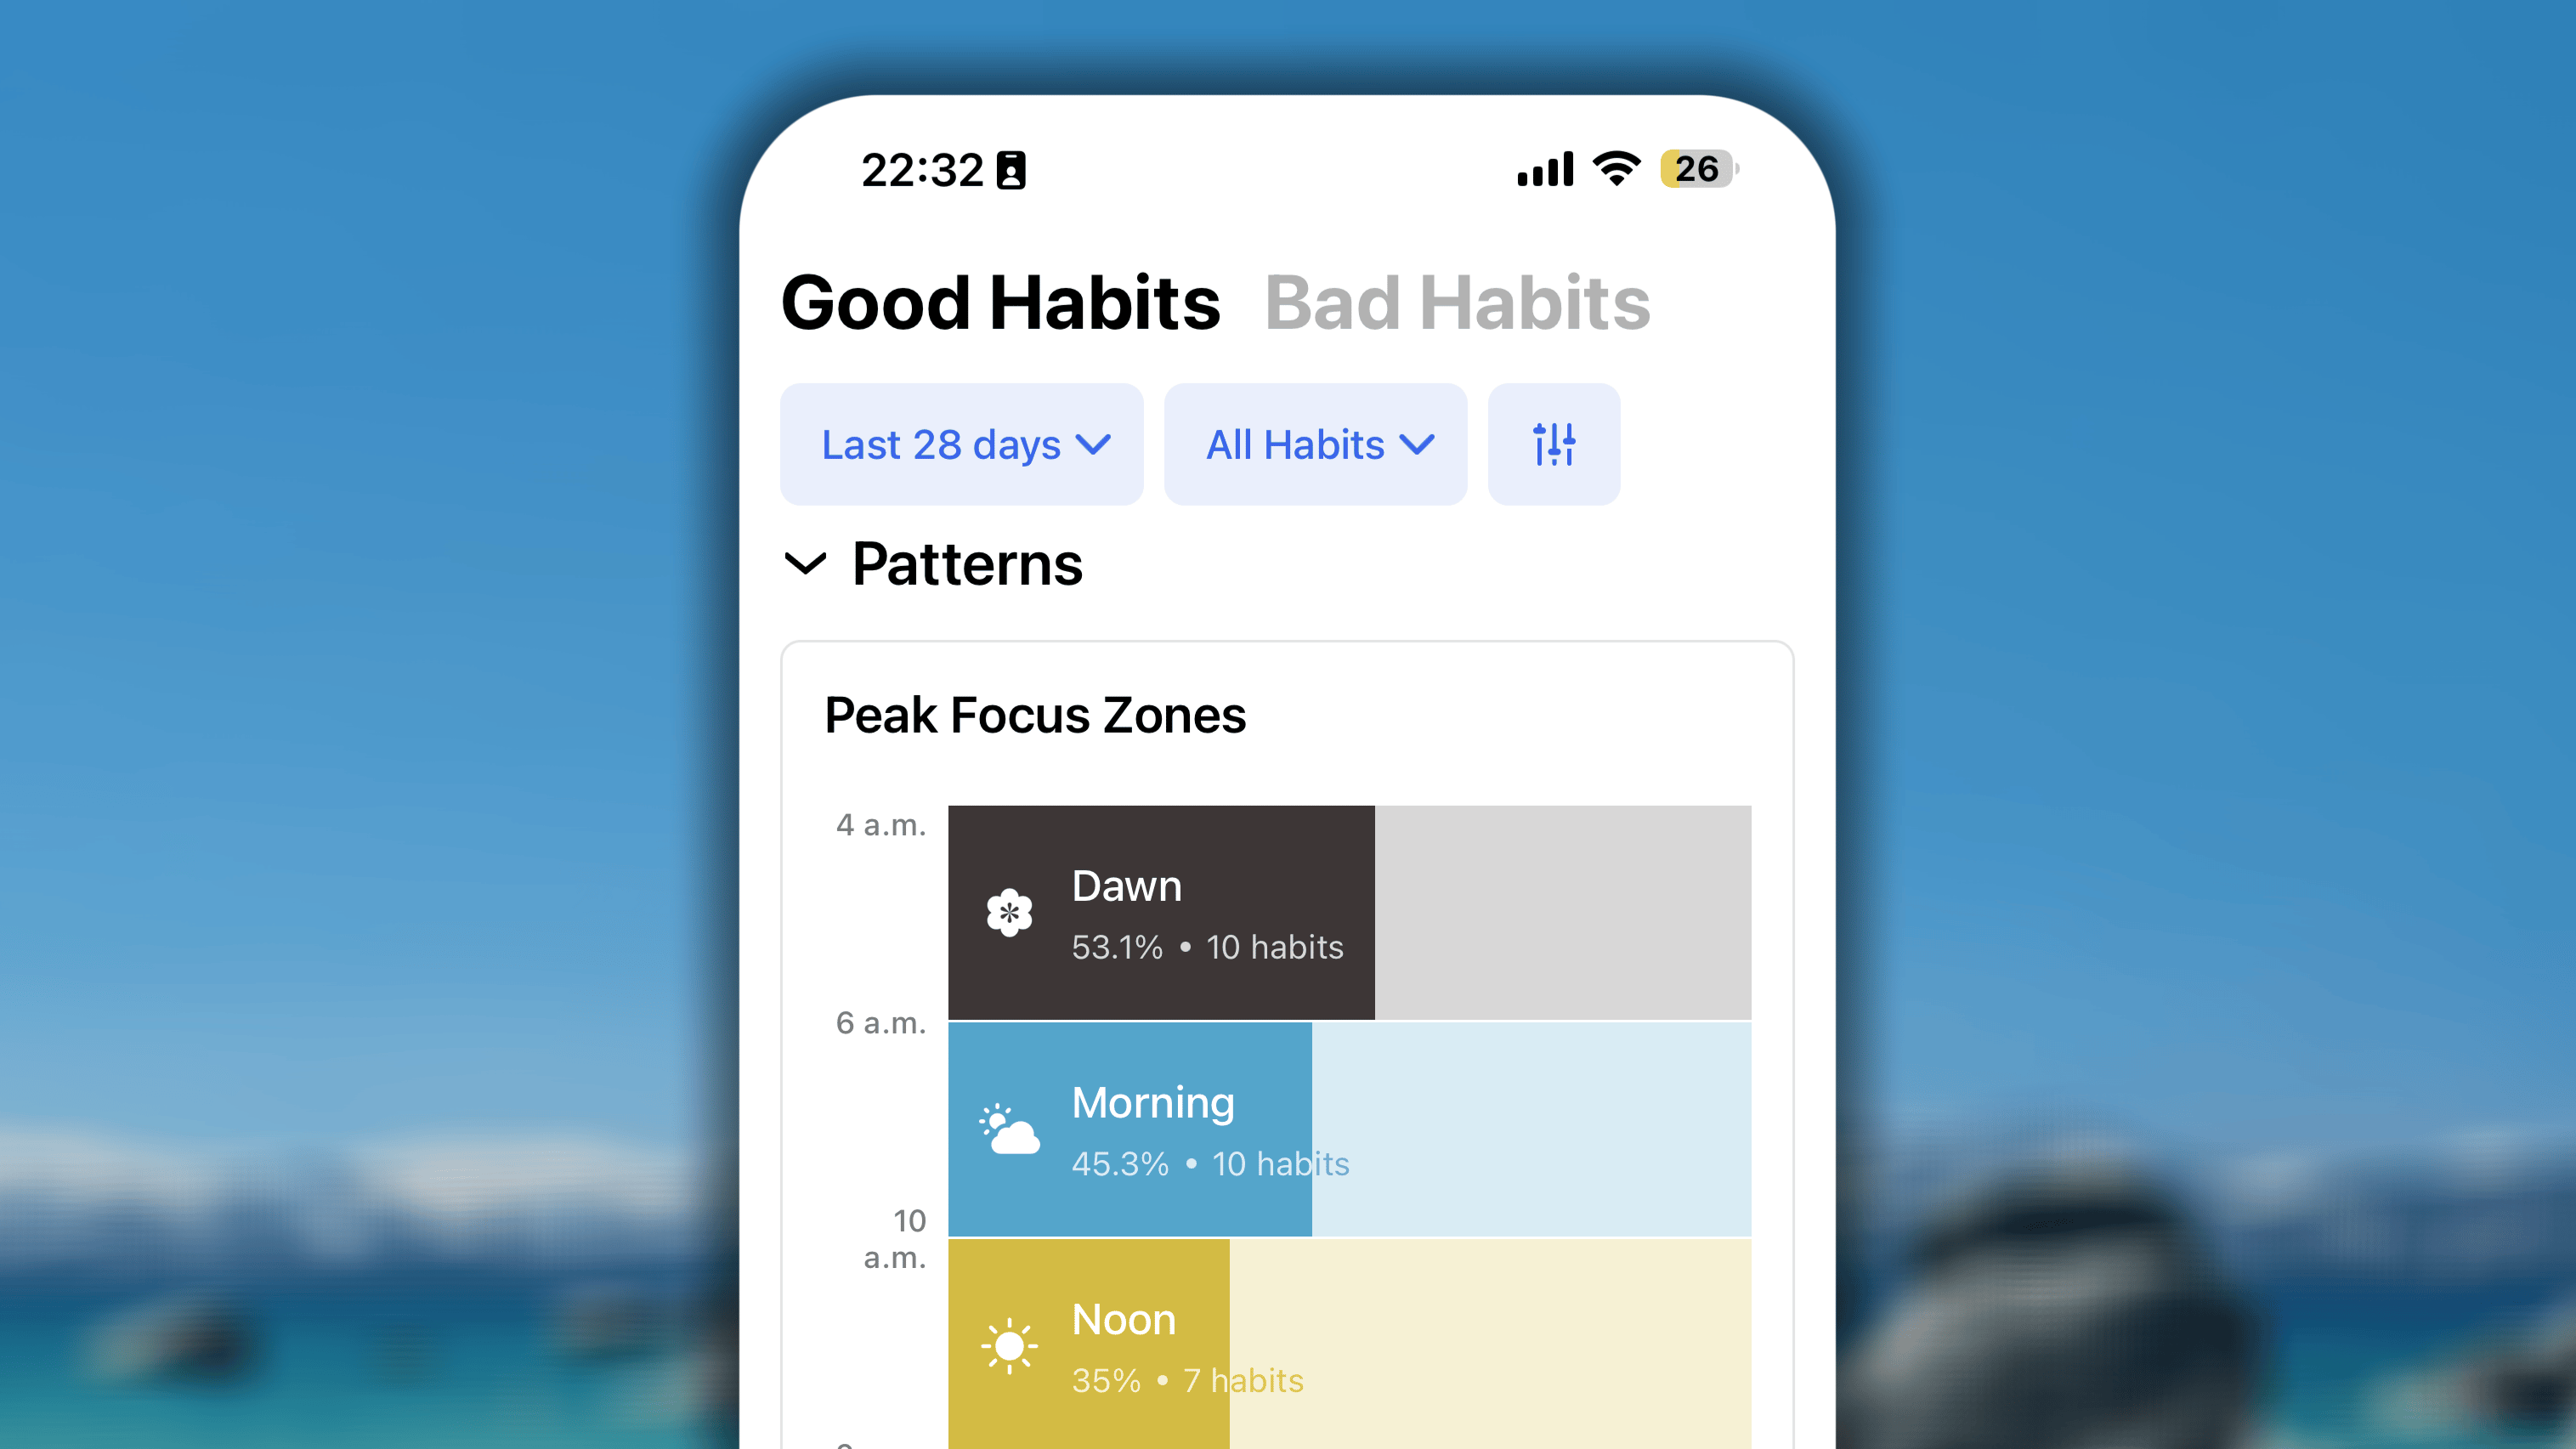
The Patterns section helps you identify when you are most productive and where you might be getting stuck. By understanding these trends, you can start working with your natural energy instead of fighting against it.This section is broken down into three powerful insights: Weekly Rhythm, Peak Focus Zones, and Missed Habits.Weekly Rhythm
Peak Focus Zones
Missed Habits
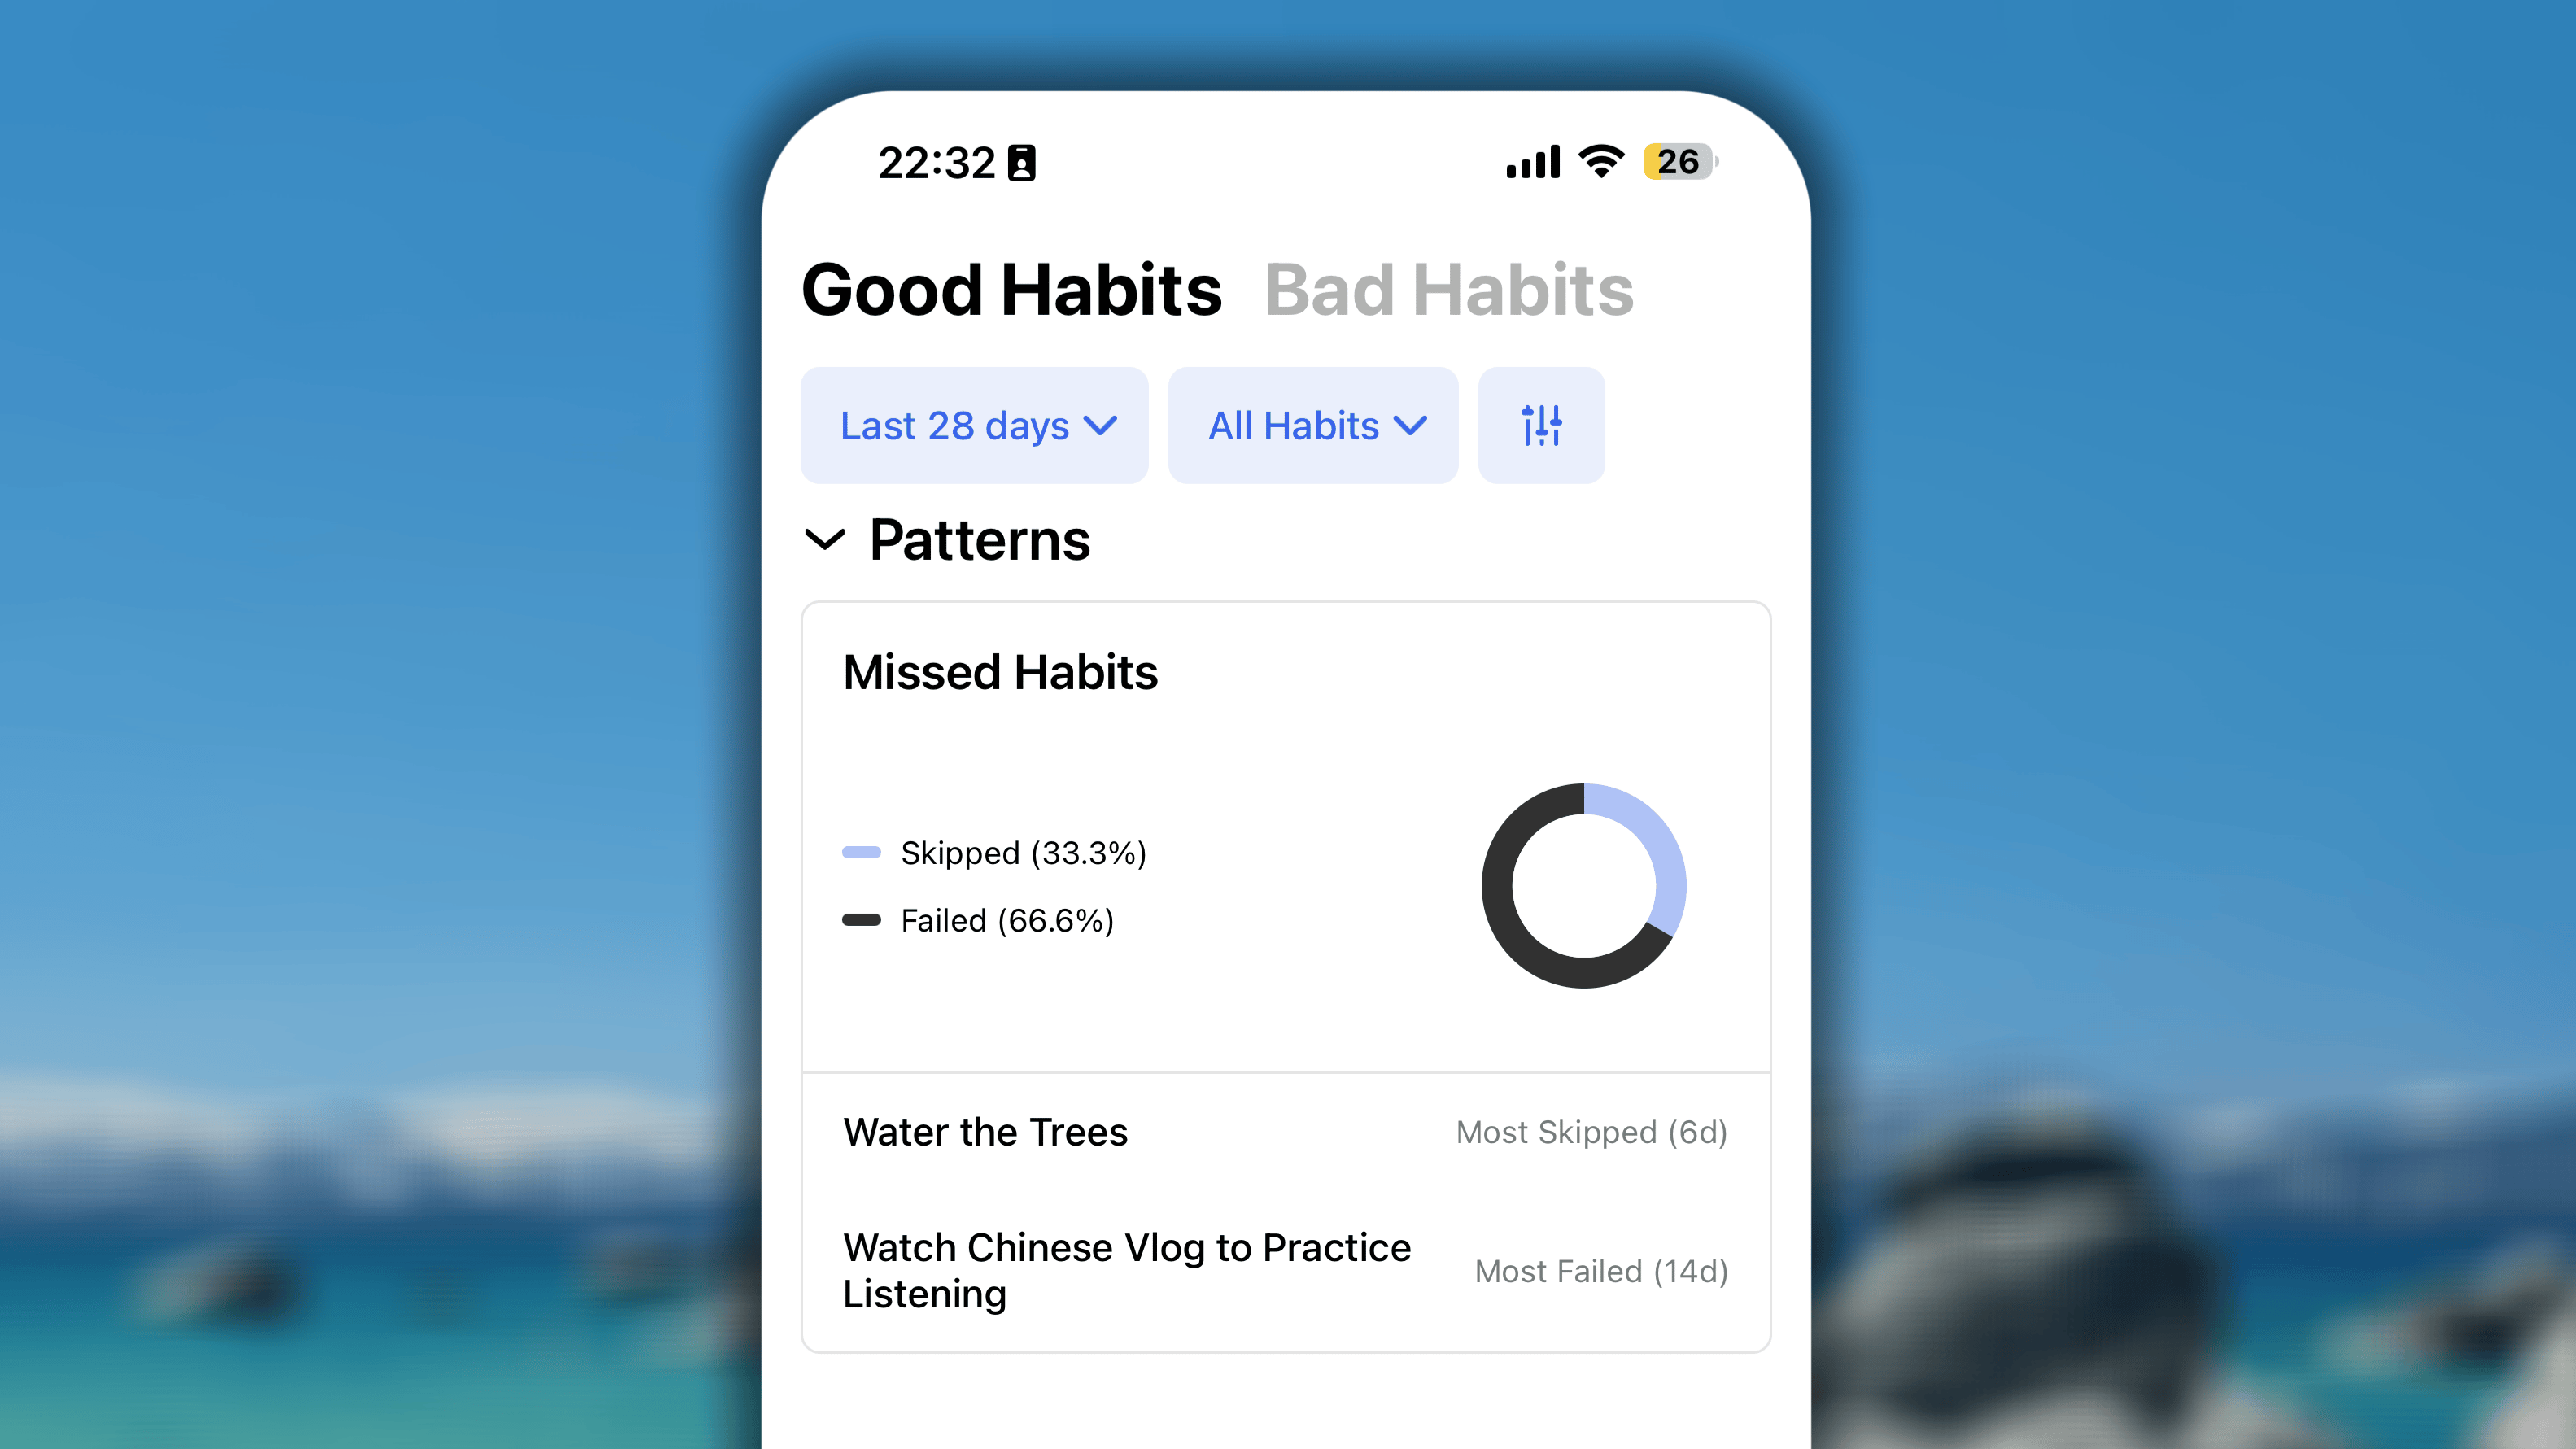
- If a specific habit earns the title of “Most Failed,” it is a clear signal that the routine needs adjustment, it might be too difficult right now or scheduled at the wrong time.
- Meanwhile, your “Most Skipped” habit might prompt you to re-evaluate if that goal is still truly relevant to your current journey.
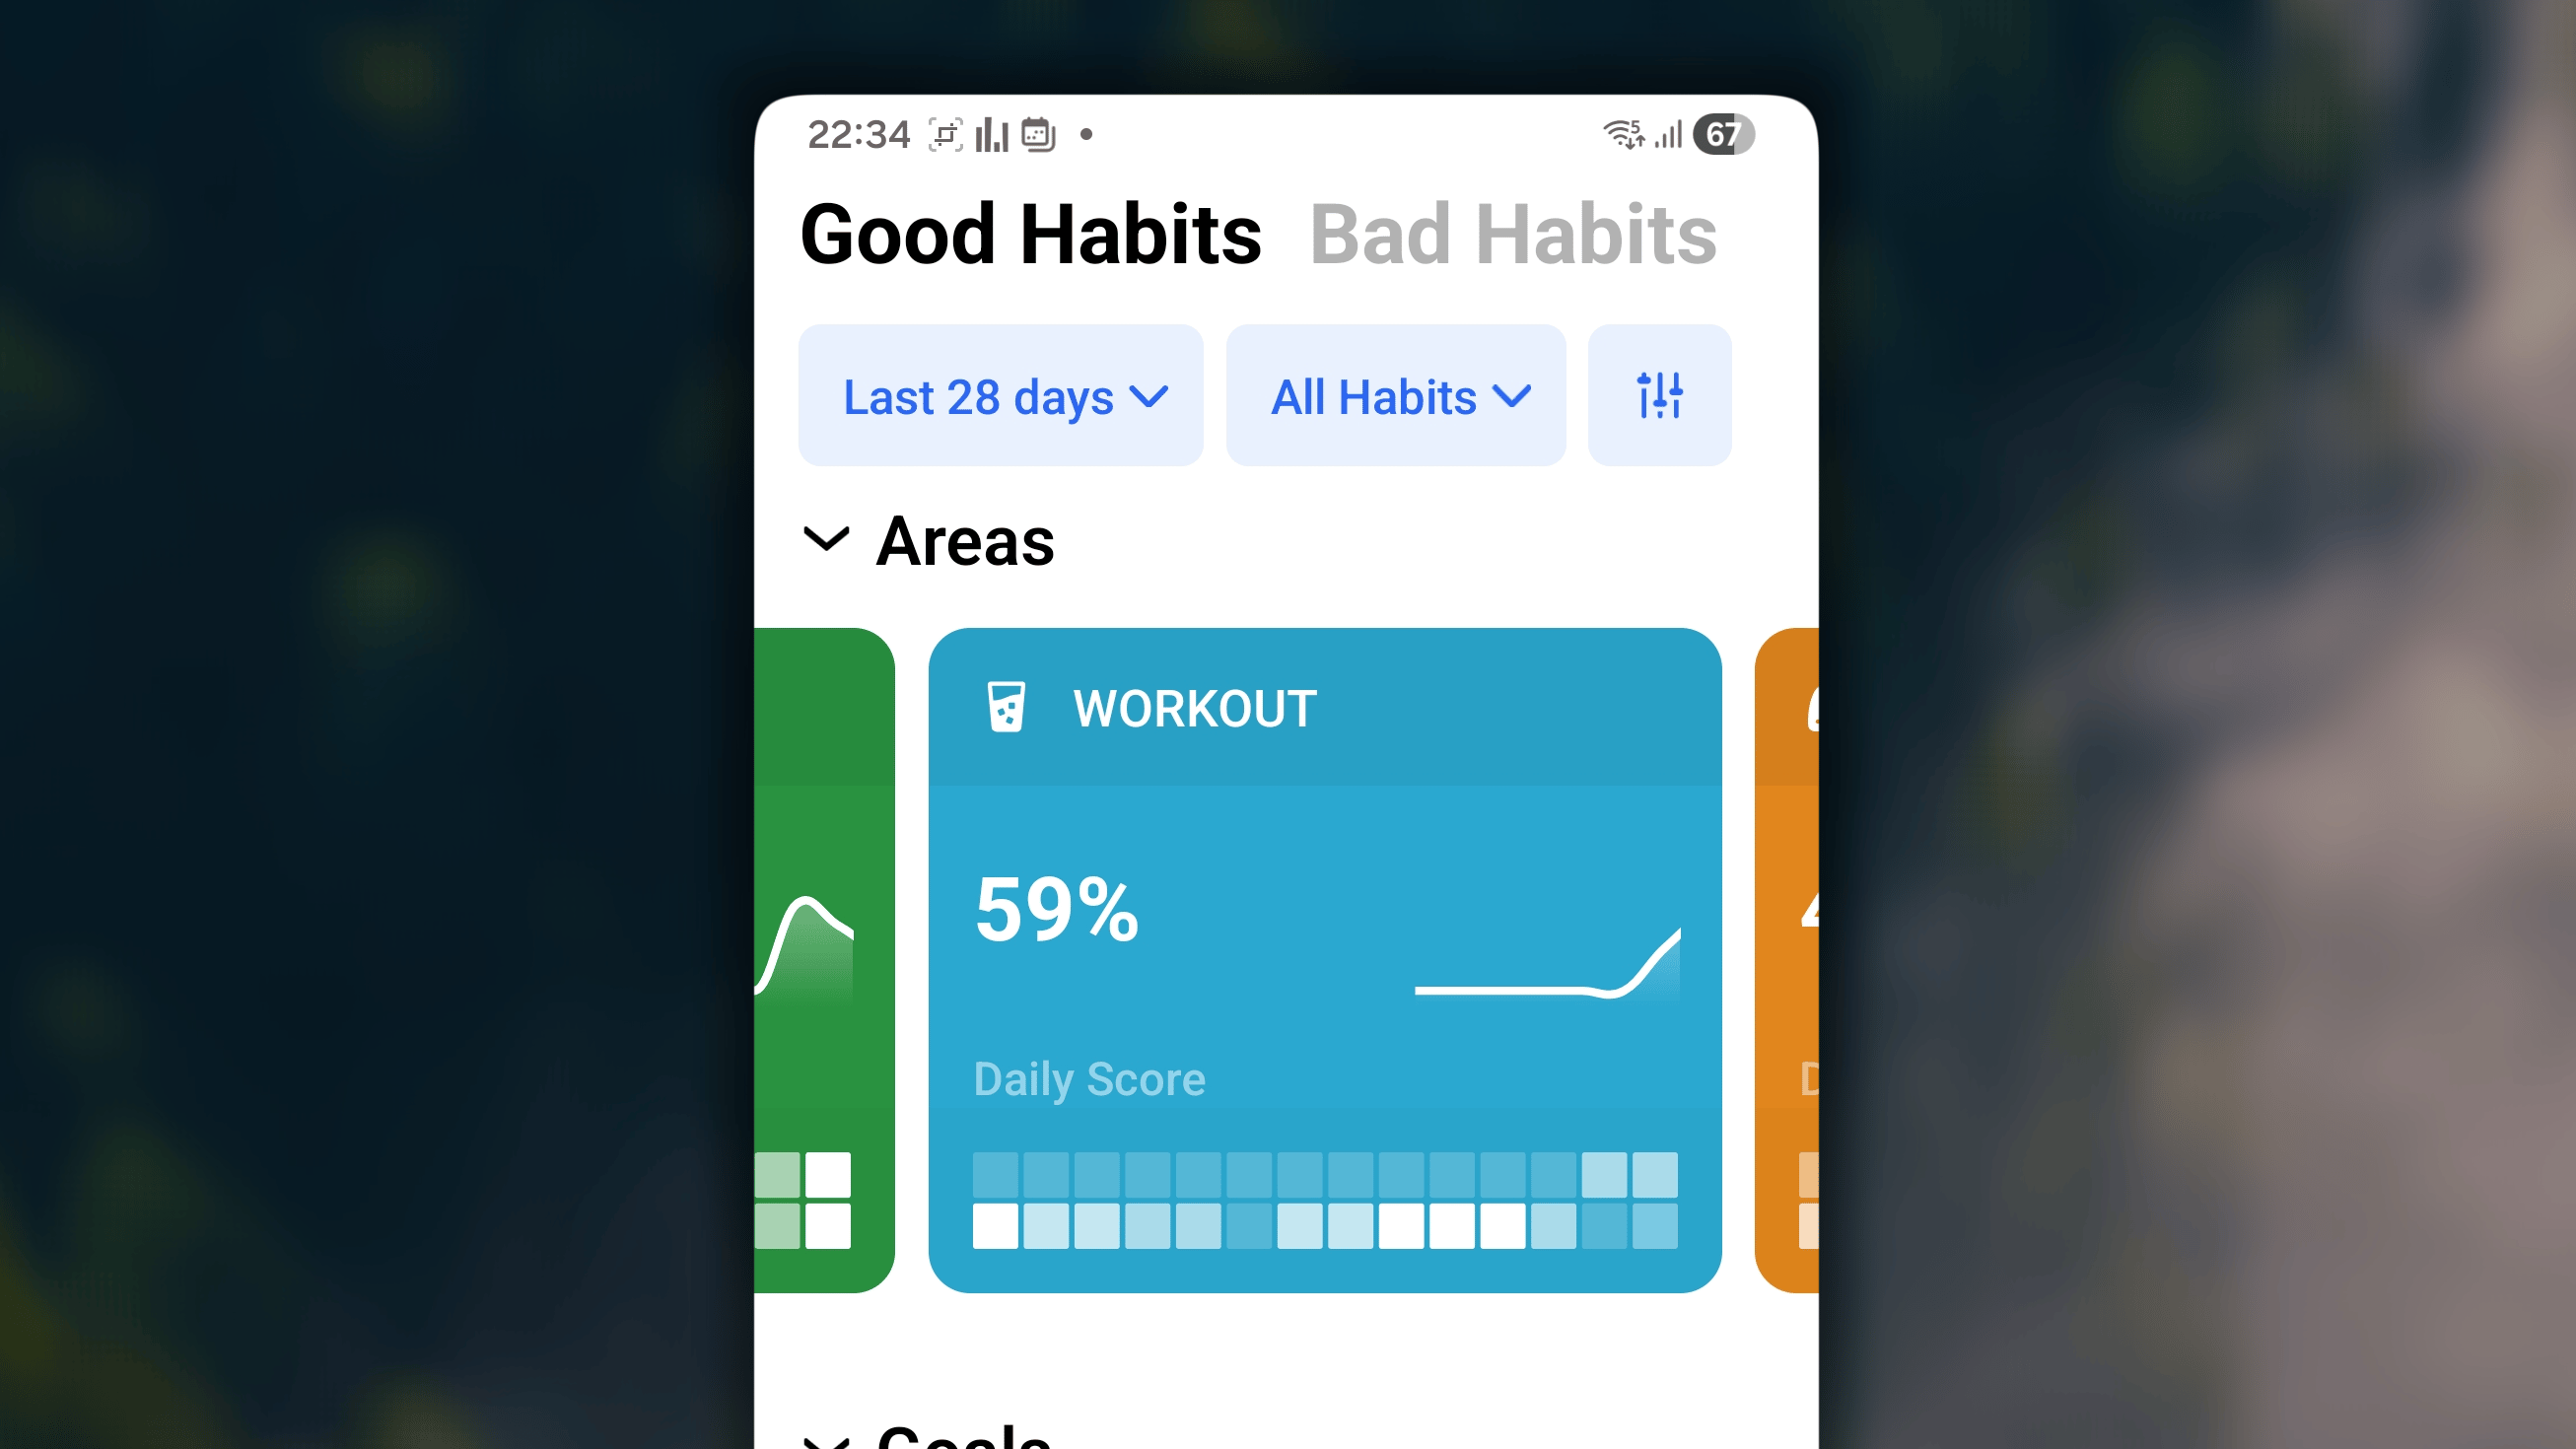
Areas
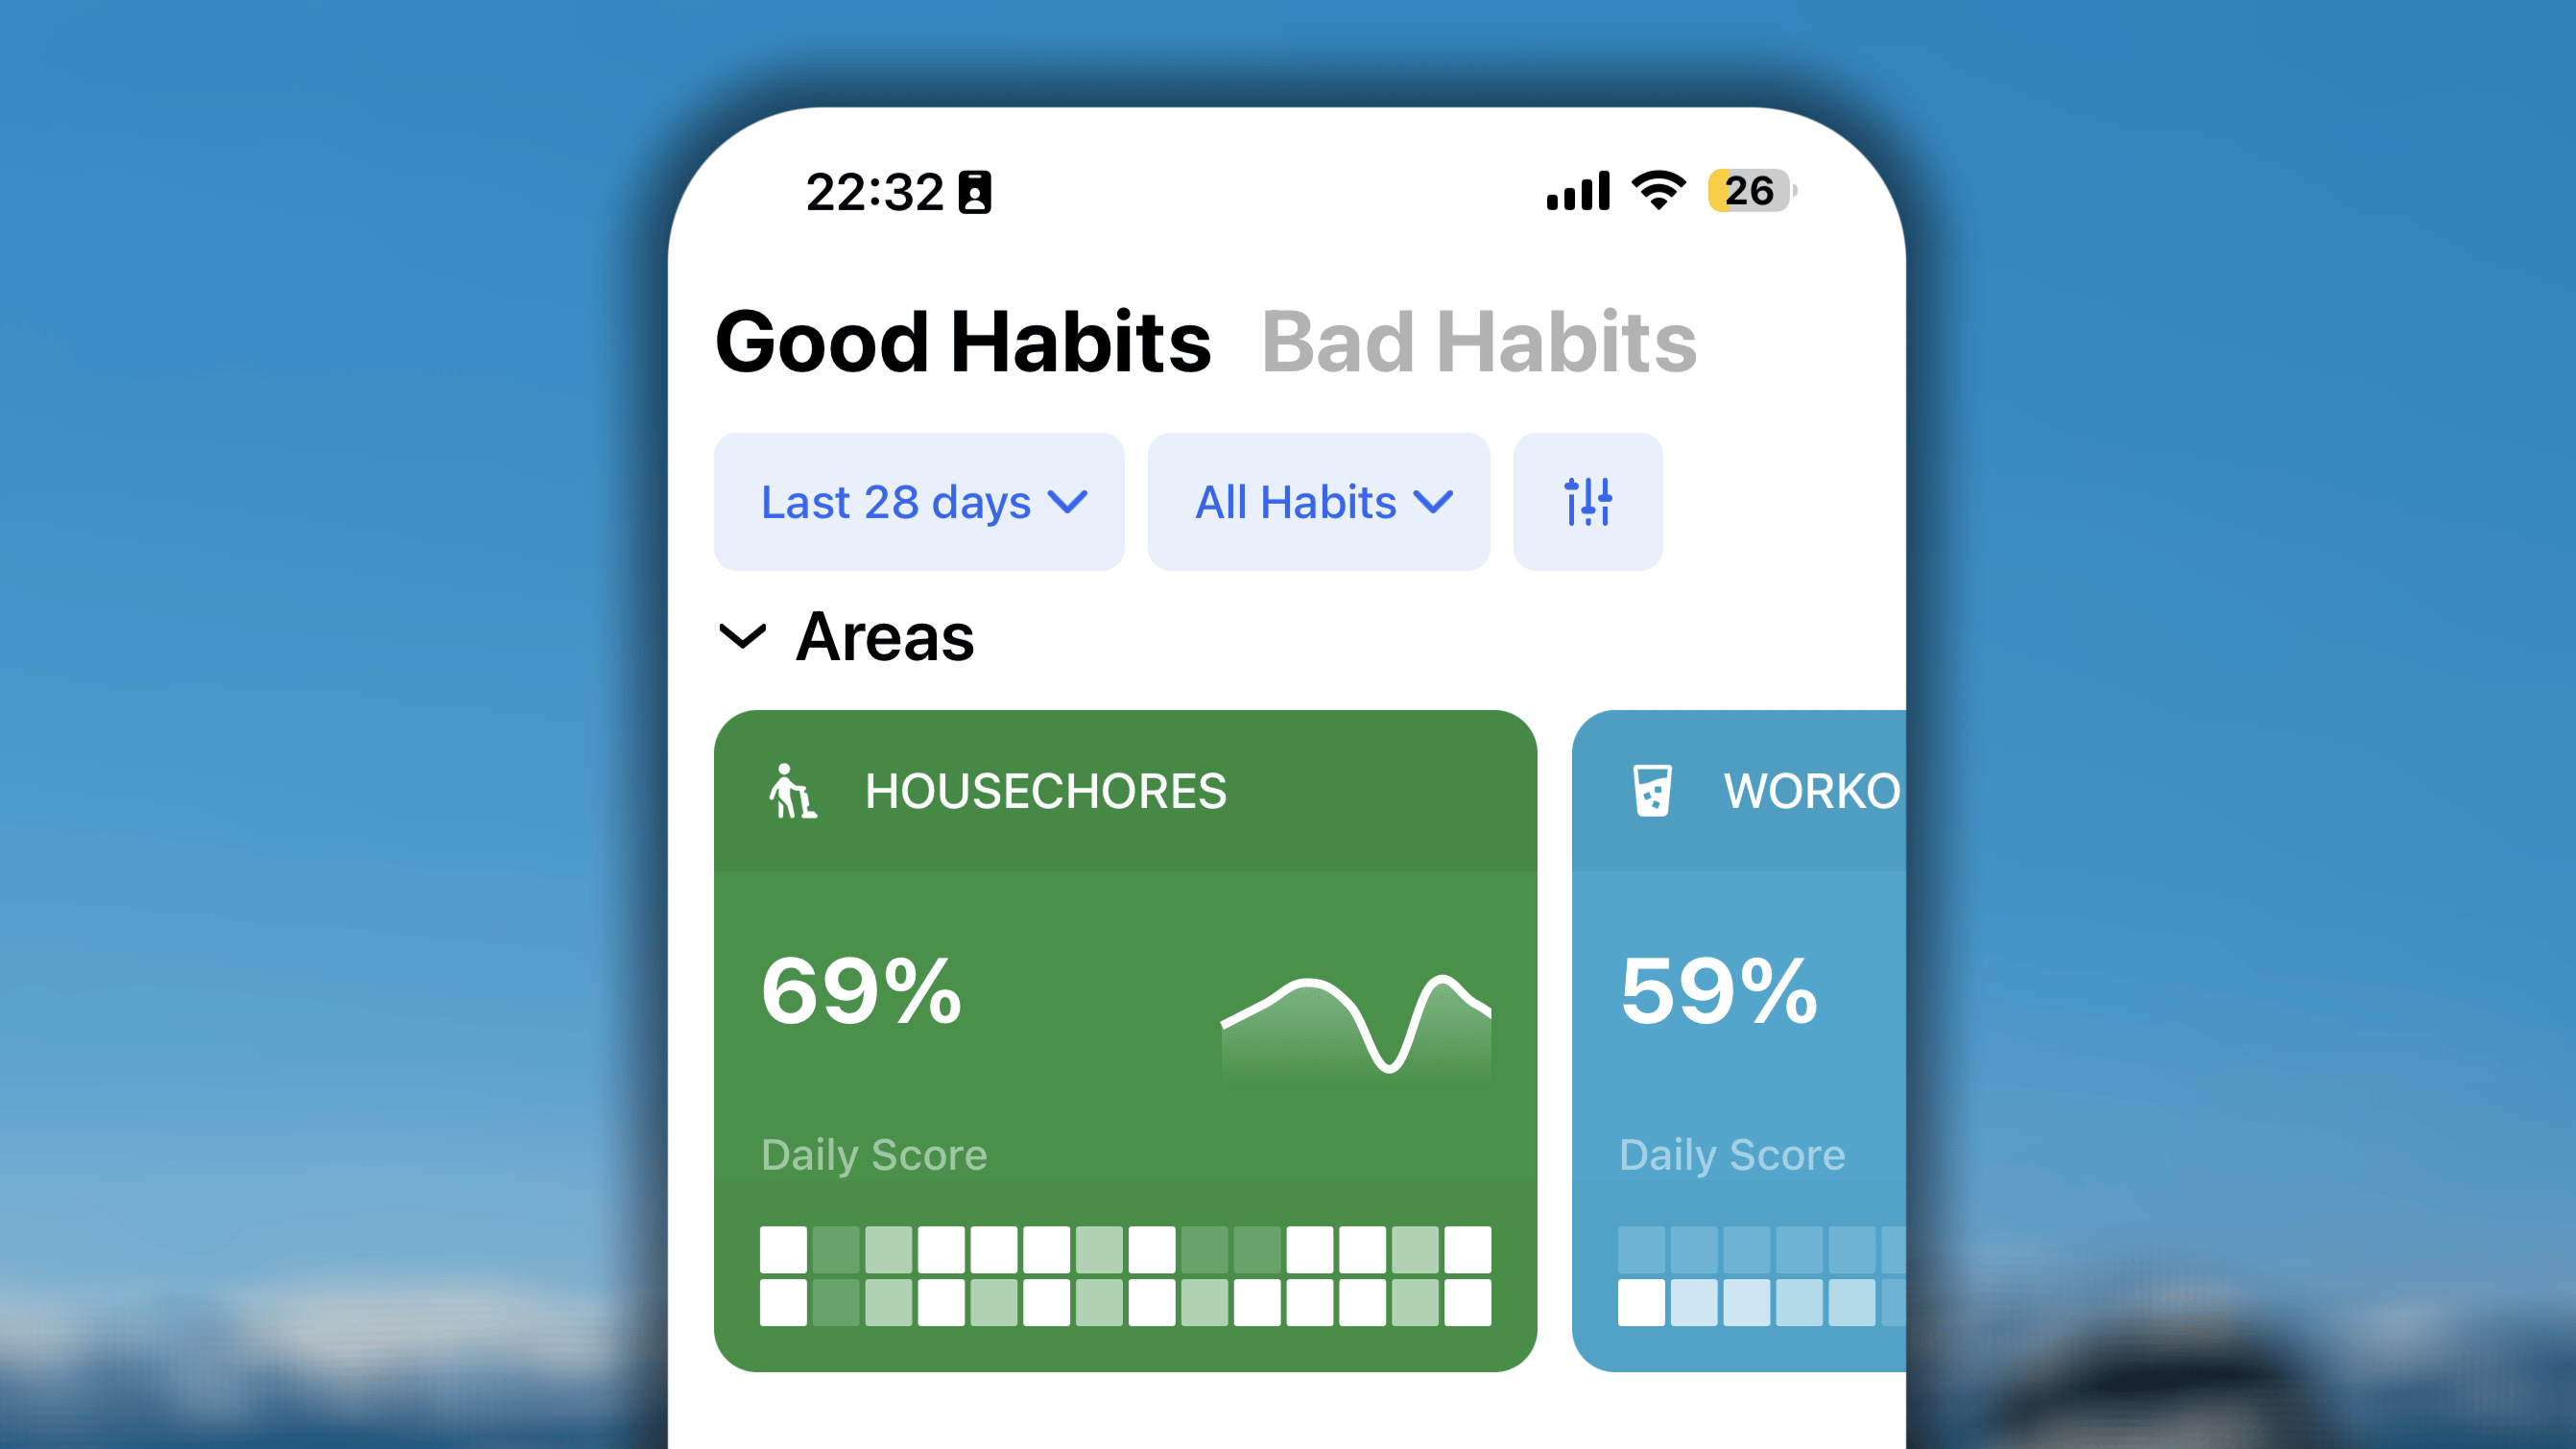
- Average Daily Score: the average completion rate per day on the habits with per-day goal included in the area, during the selected period.
- A mini trend line: the line chart representing your overall performance on the habits with per-day goal included in the area, during the selected period.
- A condensed heatmap: the heatmap visualizes your completion rate on the daily habits included in the area, durring the selected period.
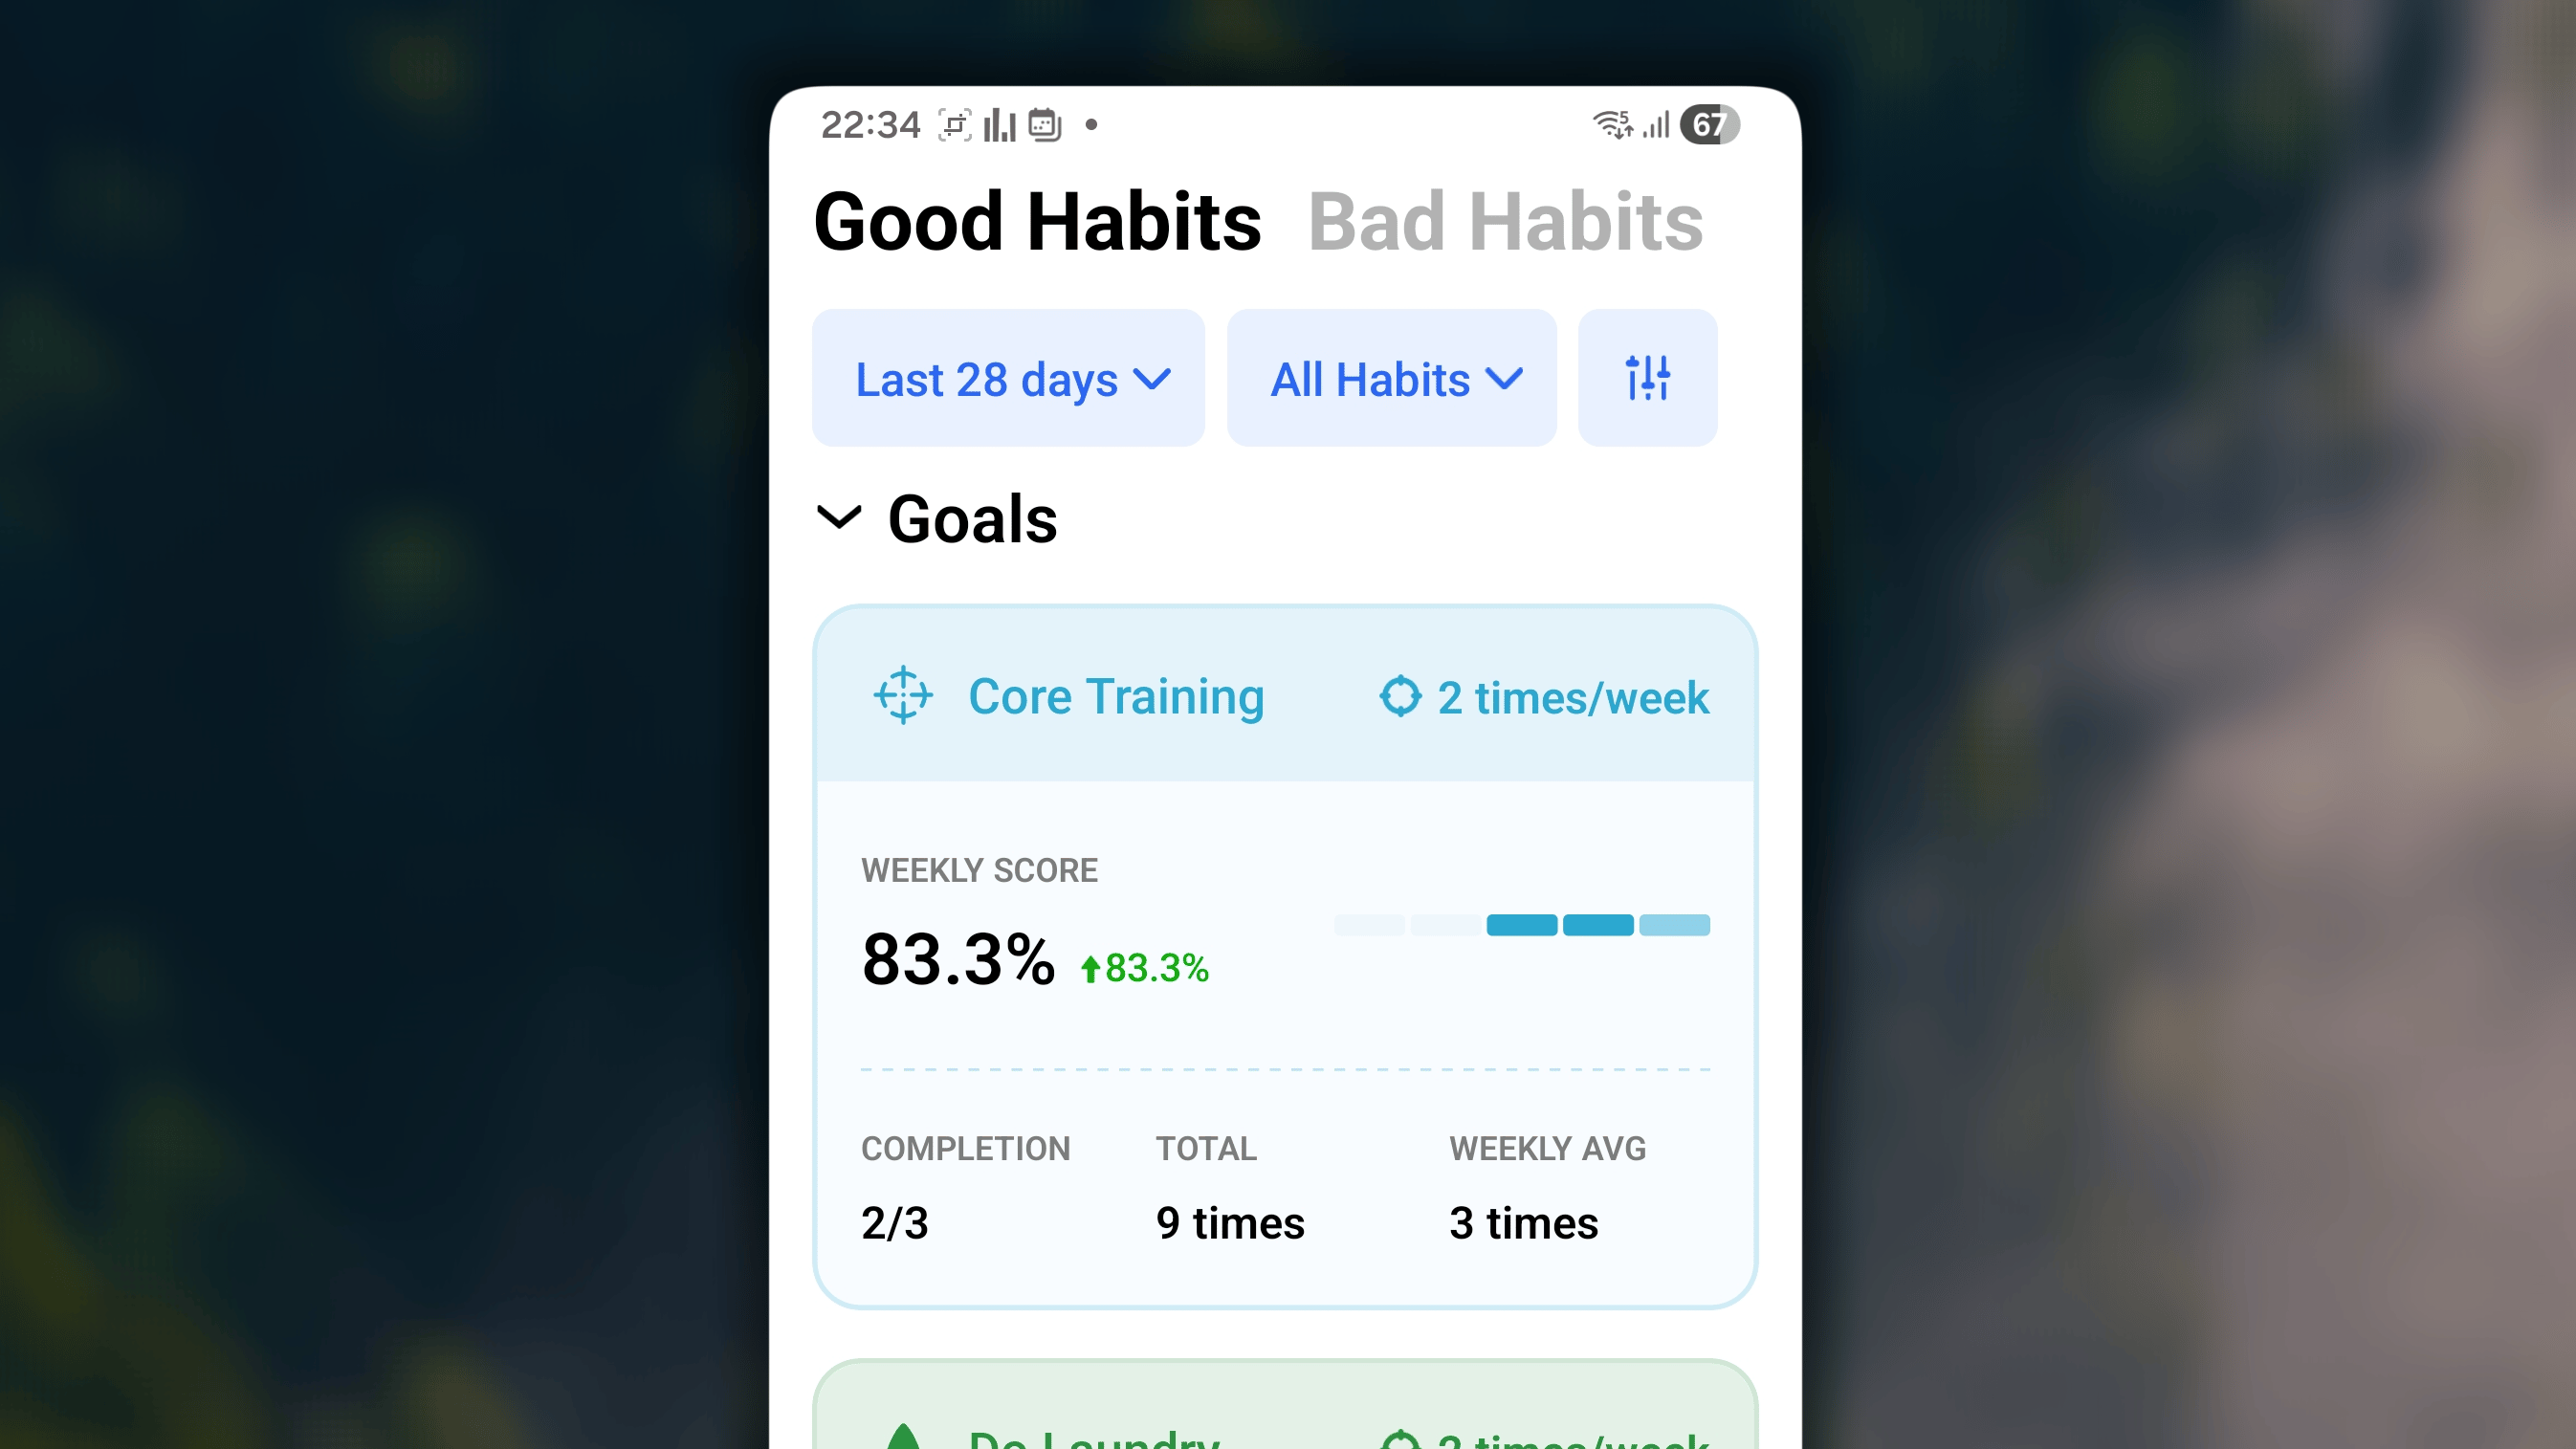
Goals
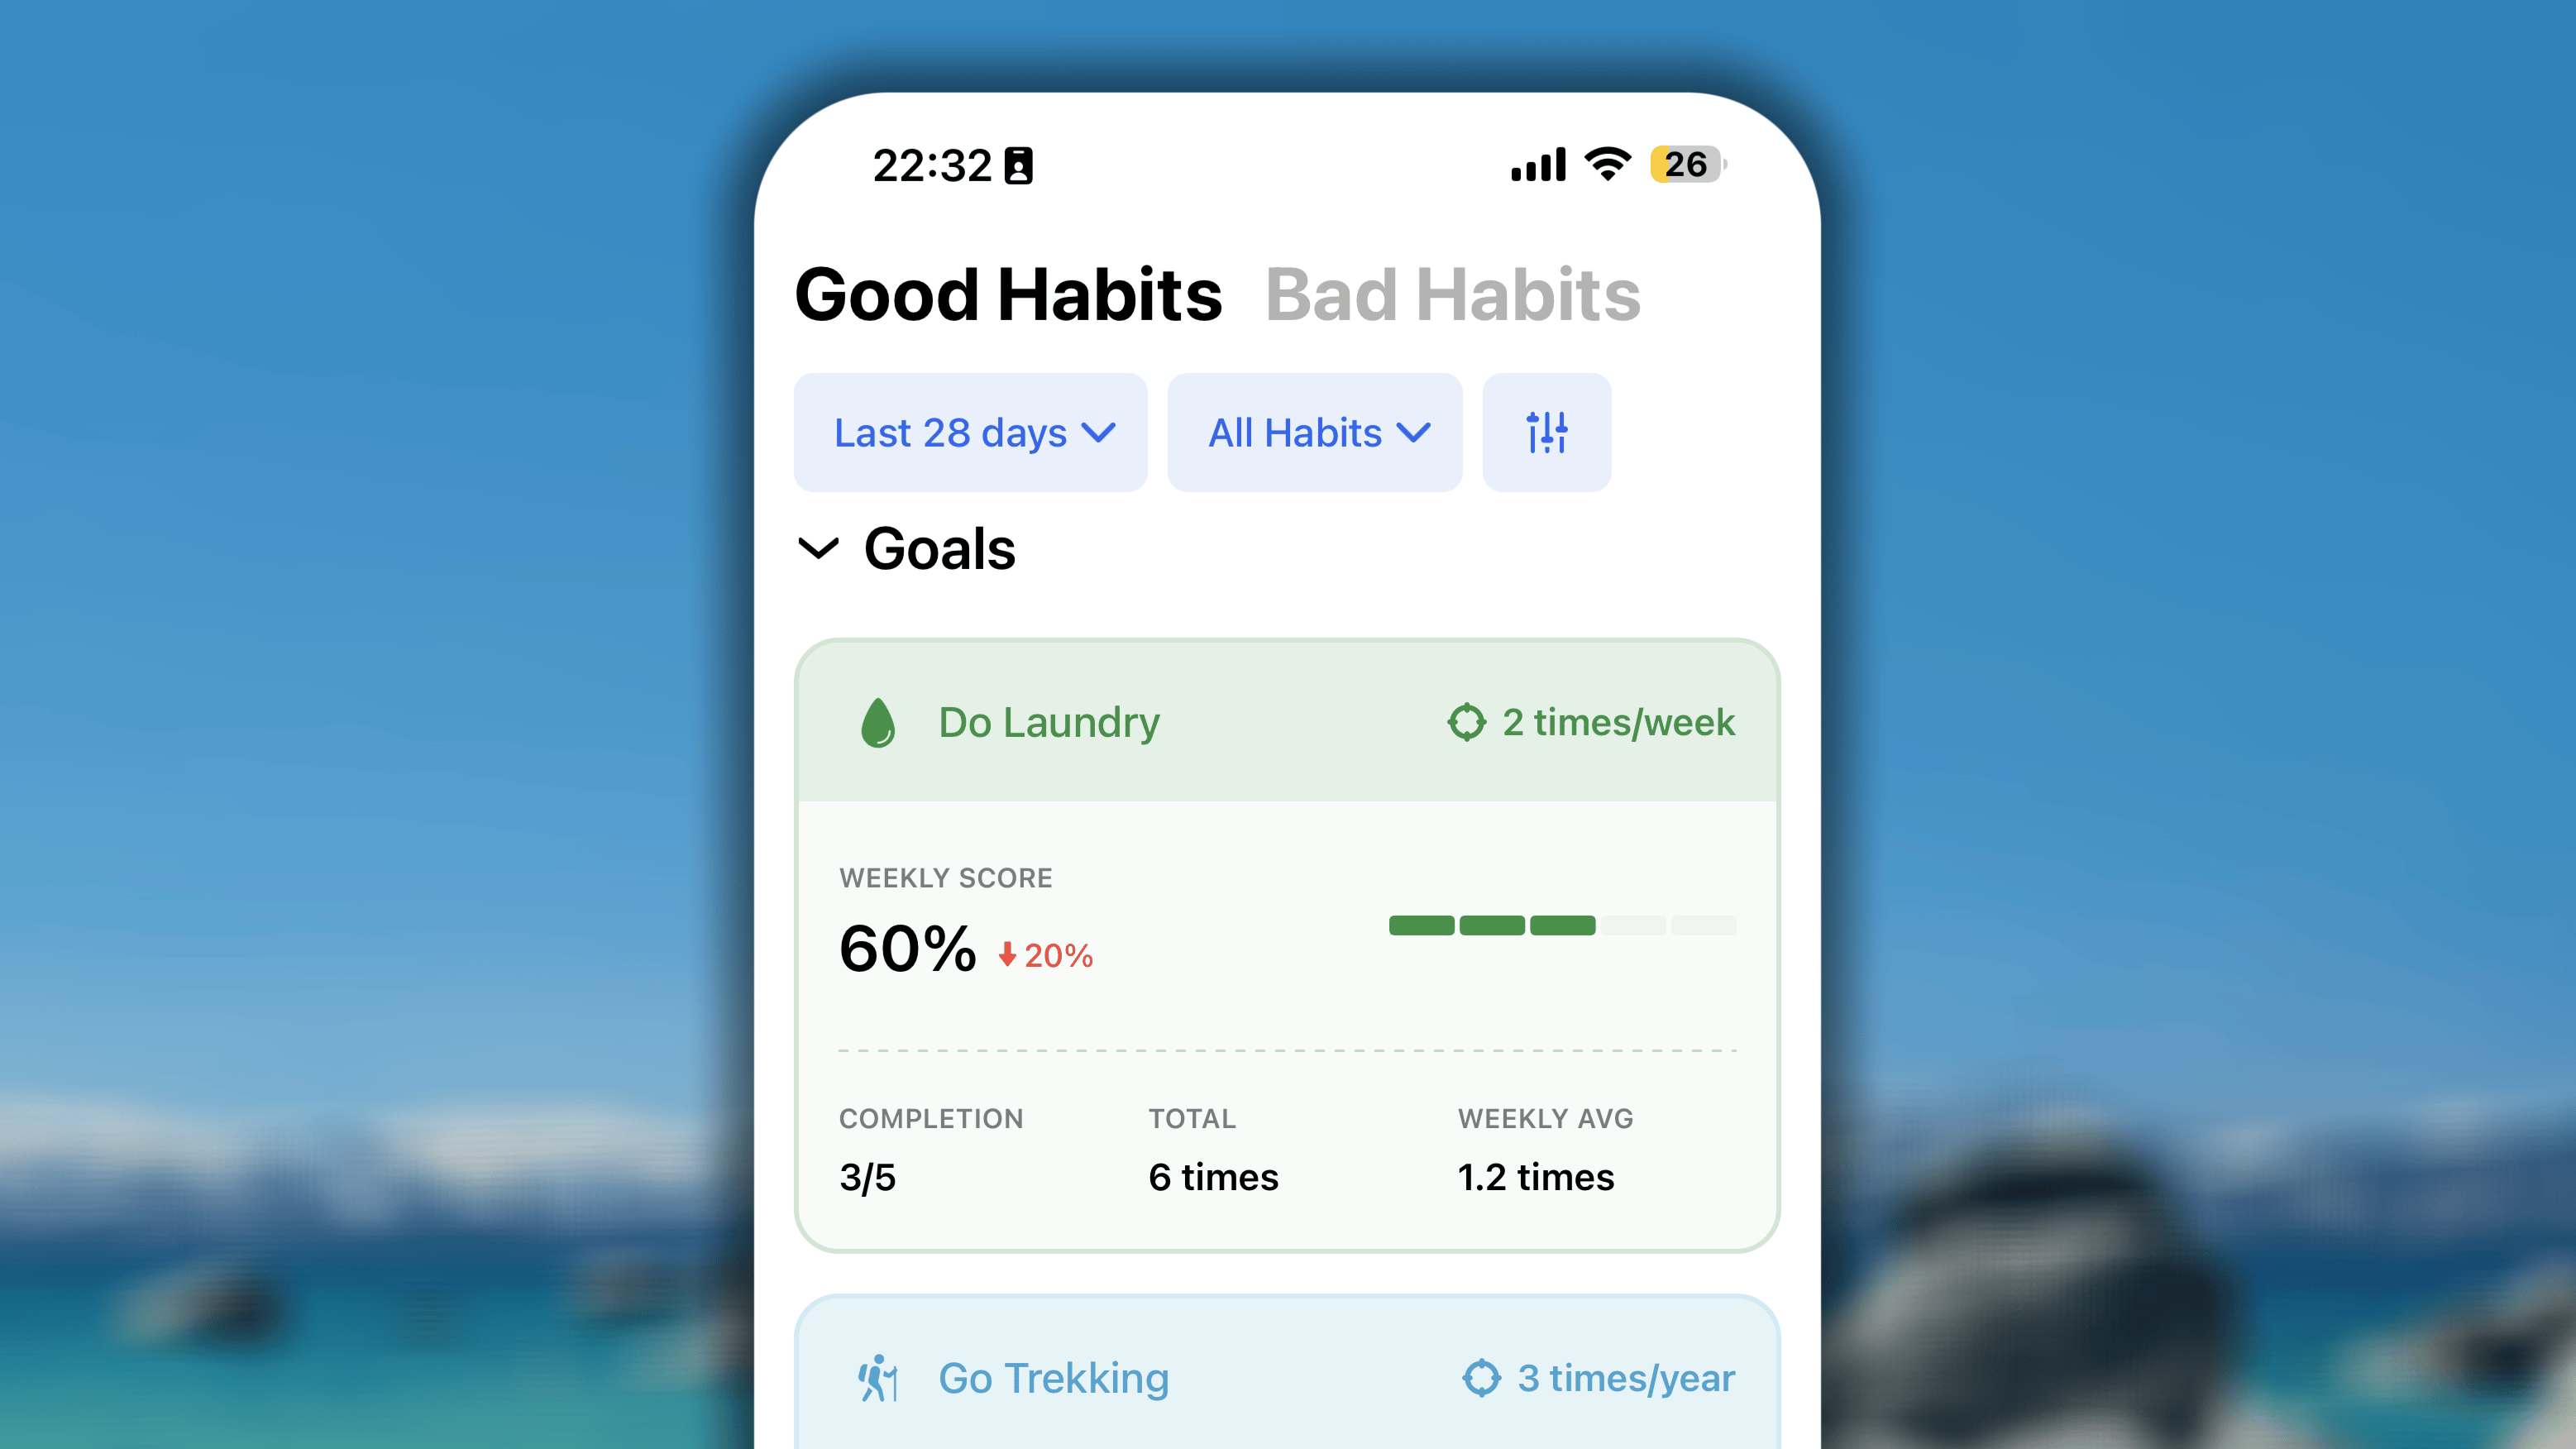
- The Header*:* Shows the habit’s name and your specific target.
- The Weekly/Monthly/Yearly Score : Represents your completion rate for the current week, month, or year.
- The heatmap: Visualizes your effor for each standard week, month, or year, with mini progress bars
- The Detail Breakdown*:*
- Completion: Counts your Completed cycles (e.g., 7/15 weeks),
- Total: Sum up your progress value logged within the date range chosen in the date filter.
- Weekly/Monthly/Yearly Avg: Calculates the average value you achieve per standard week, month, or year included in the date range.
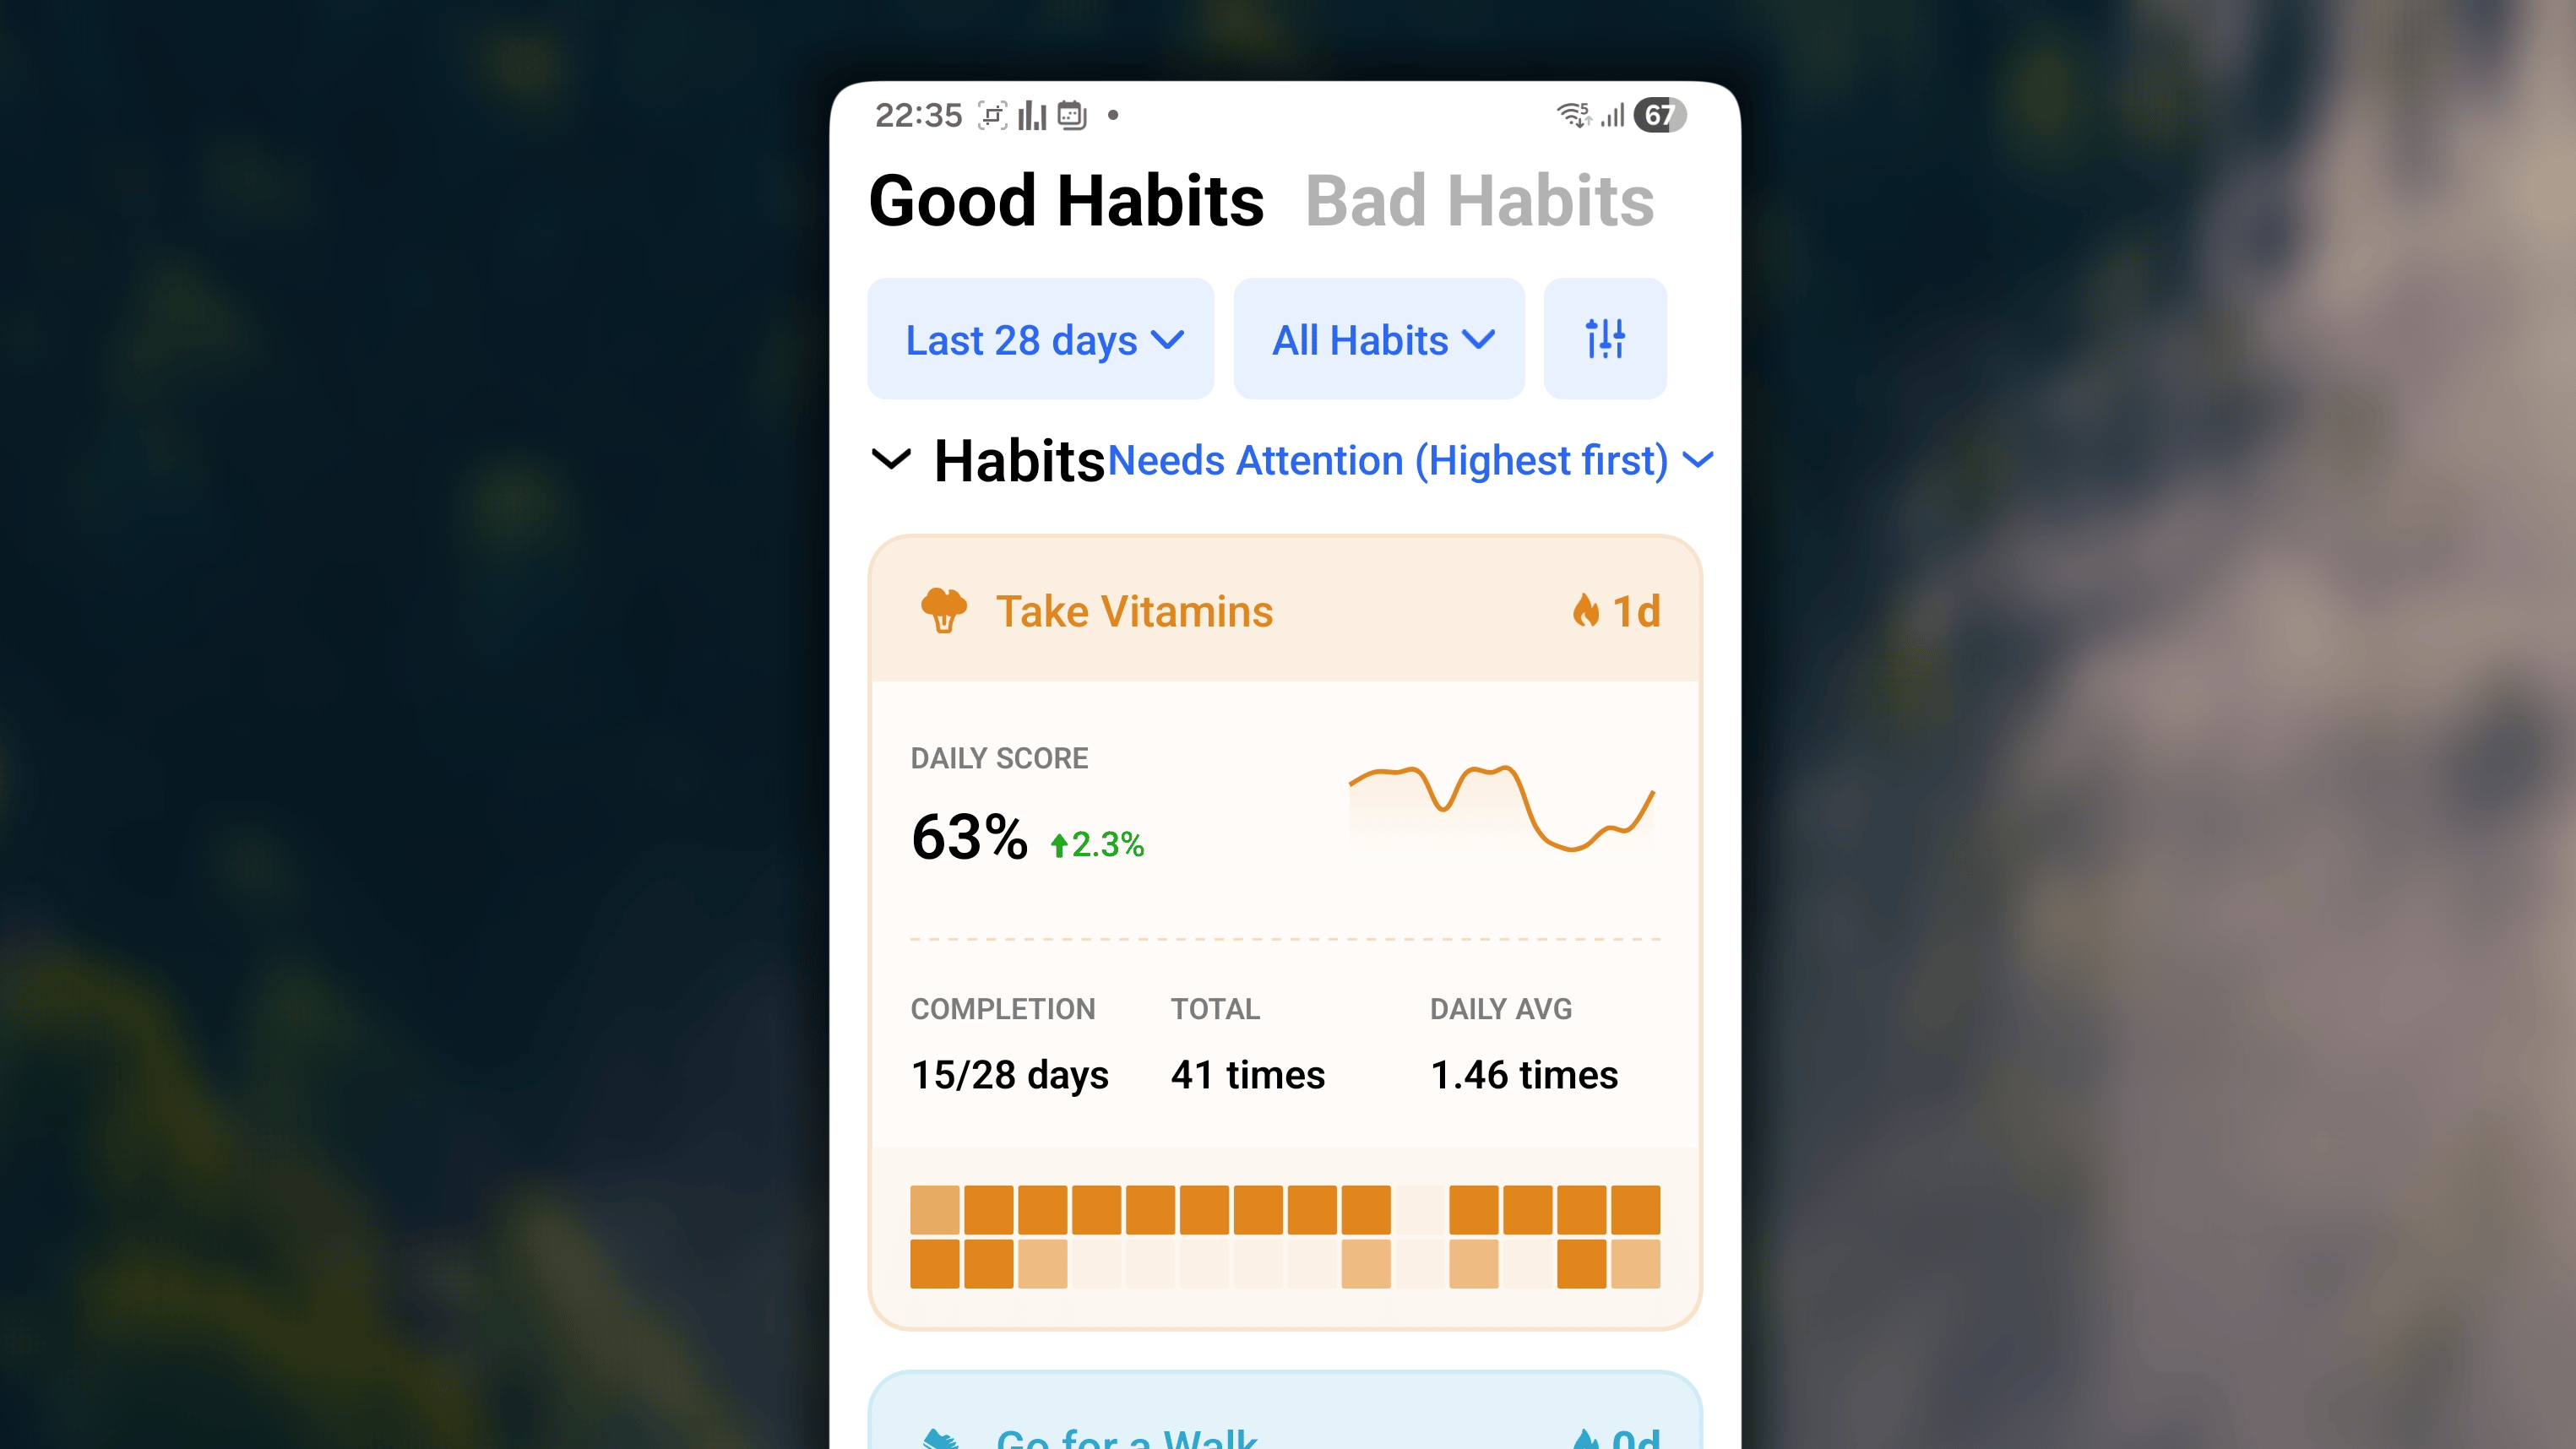
Habits
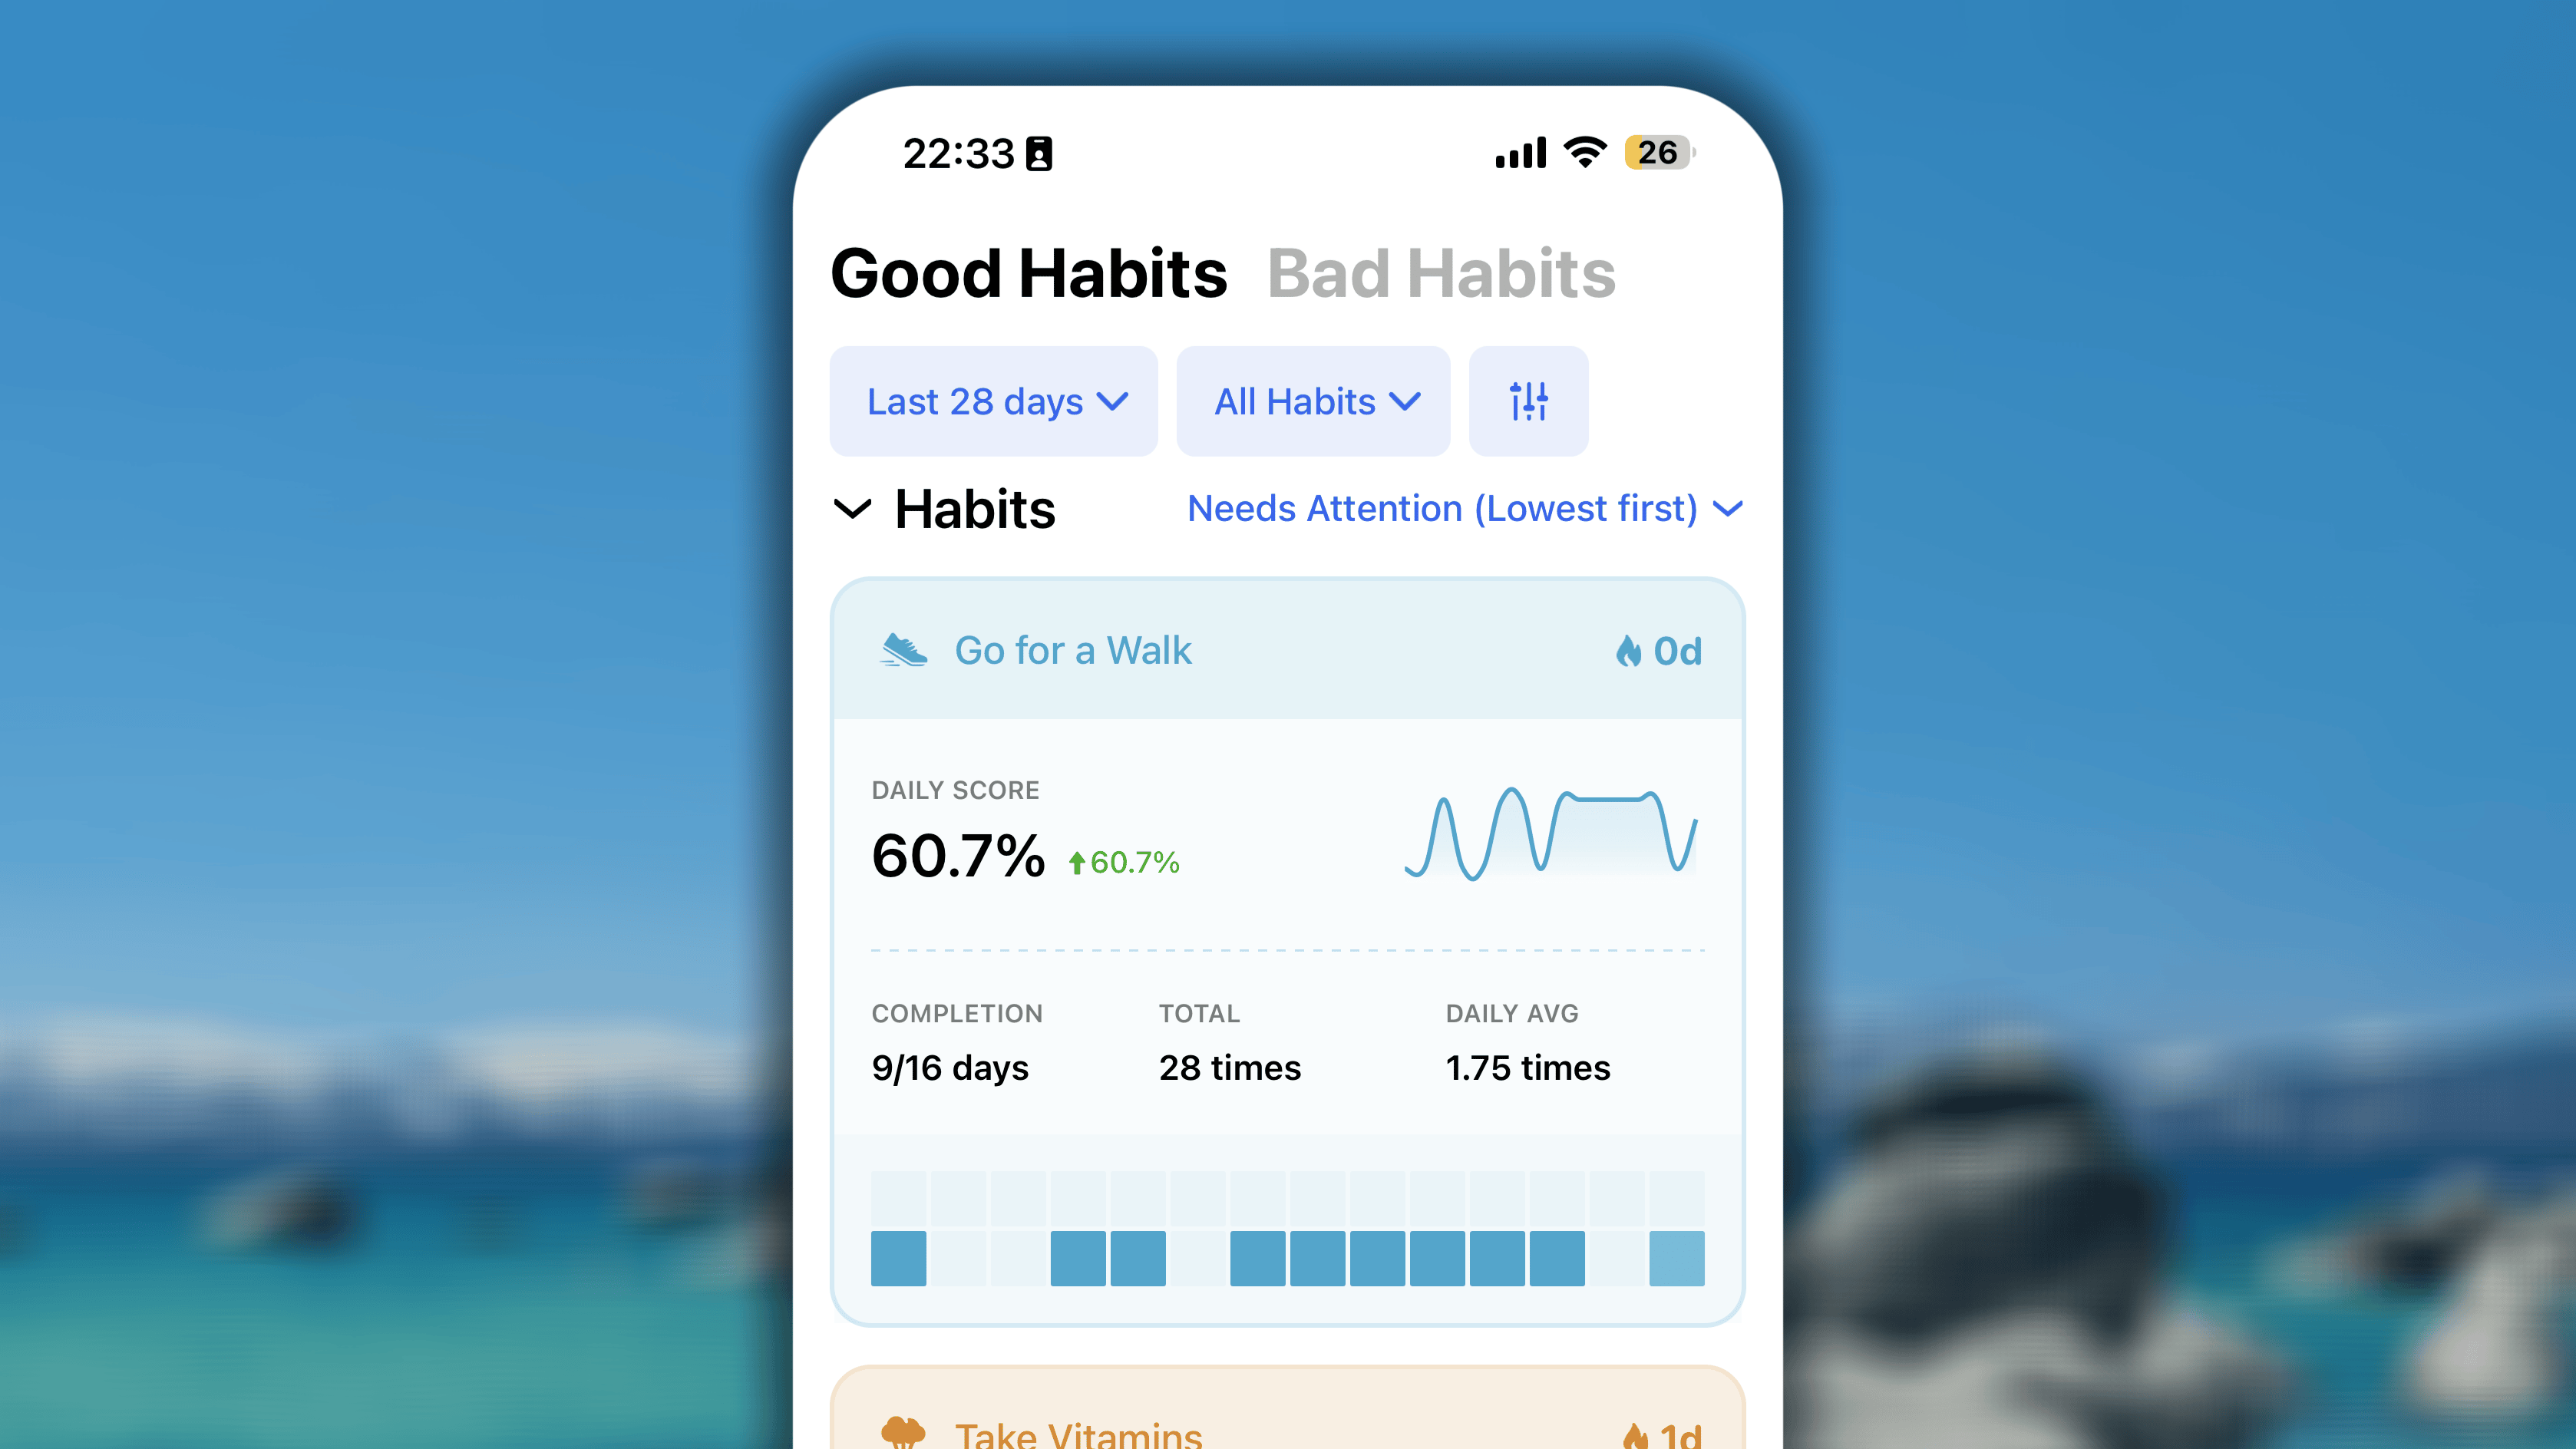
- The Header*:* Displays the habit’s name next to a flame icon showing your current active streak.
- Score & Trend*:* Your Daily Score for this specific habit, complete with a trend line.
- The Detail Breakdown*:* Shows your Completion ratio (e.g., 7/15 days), your Total cumulative value achieved, and your Daily Avg value.
- The Mini-Heatmap*:* A personalized heatmap isolating the daily effort for just this one habit.
Progress: Bad Habits
Date Range & Habit Controls
Your filtering tools are located in the top right corner of the screen. It allows you to adjust the time frame using standard milestones (7, 14, 28 days, etc.) or custom start and end dates.These filters allow you to isolate your data. If you are doing a “Sober October” or a 30-day digital detox, you can set the exact date parameters to see a focused report card for that specific challenge.Daily Effort Overview
When you first open the “Bad Habits” tab, you are greeted with an overview of your effort over the selected time range. The layout might look similar to the “Good Habits” tab, but the goal here is the exact opposite.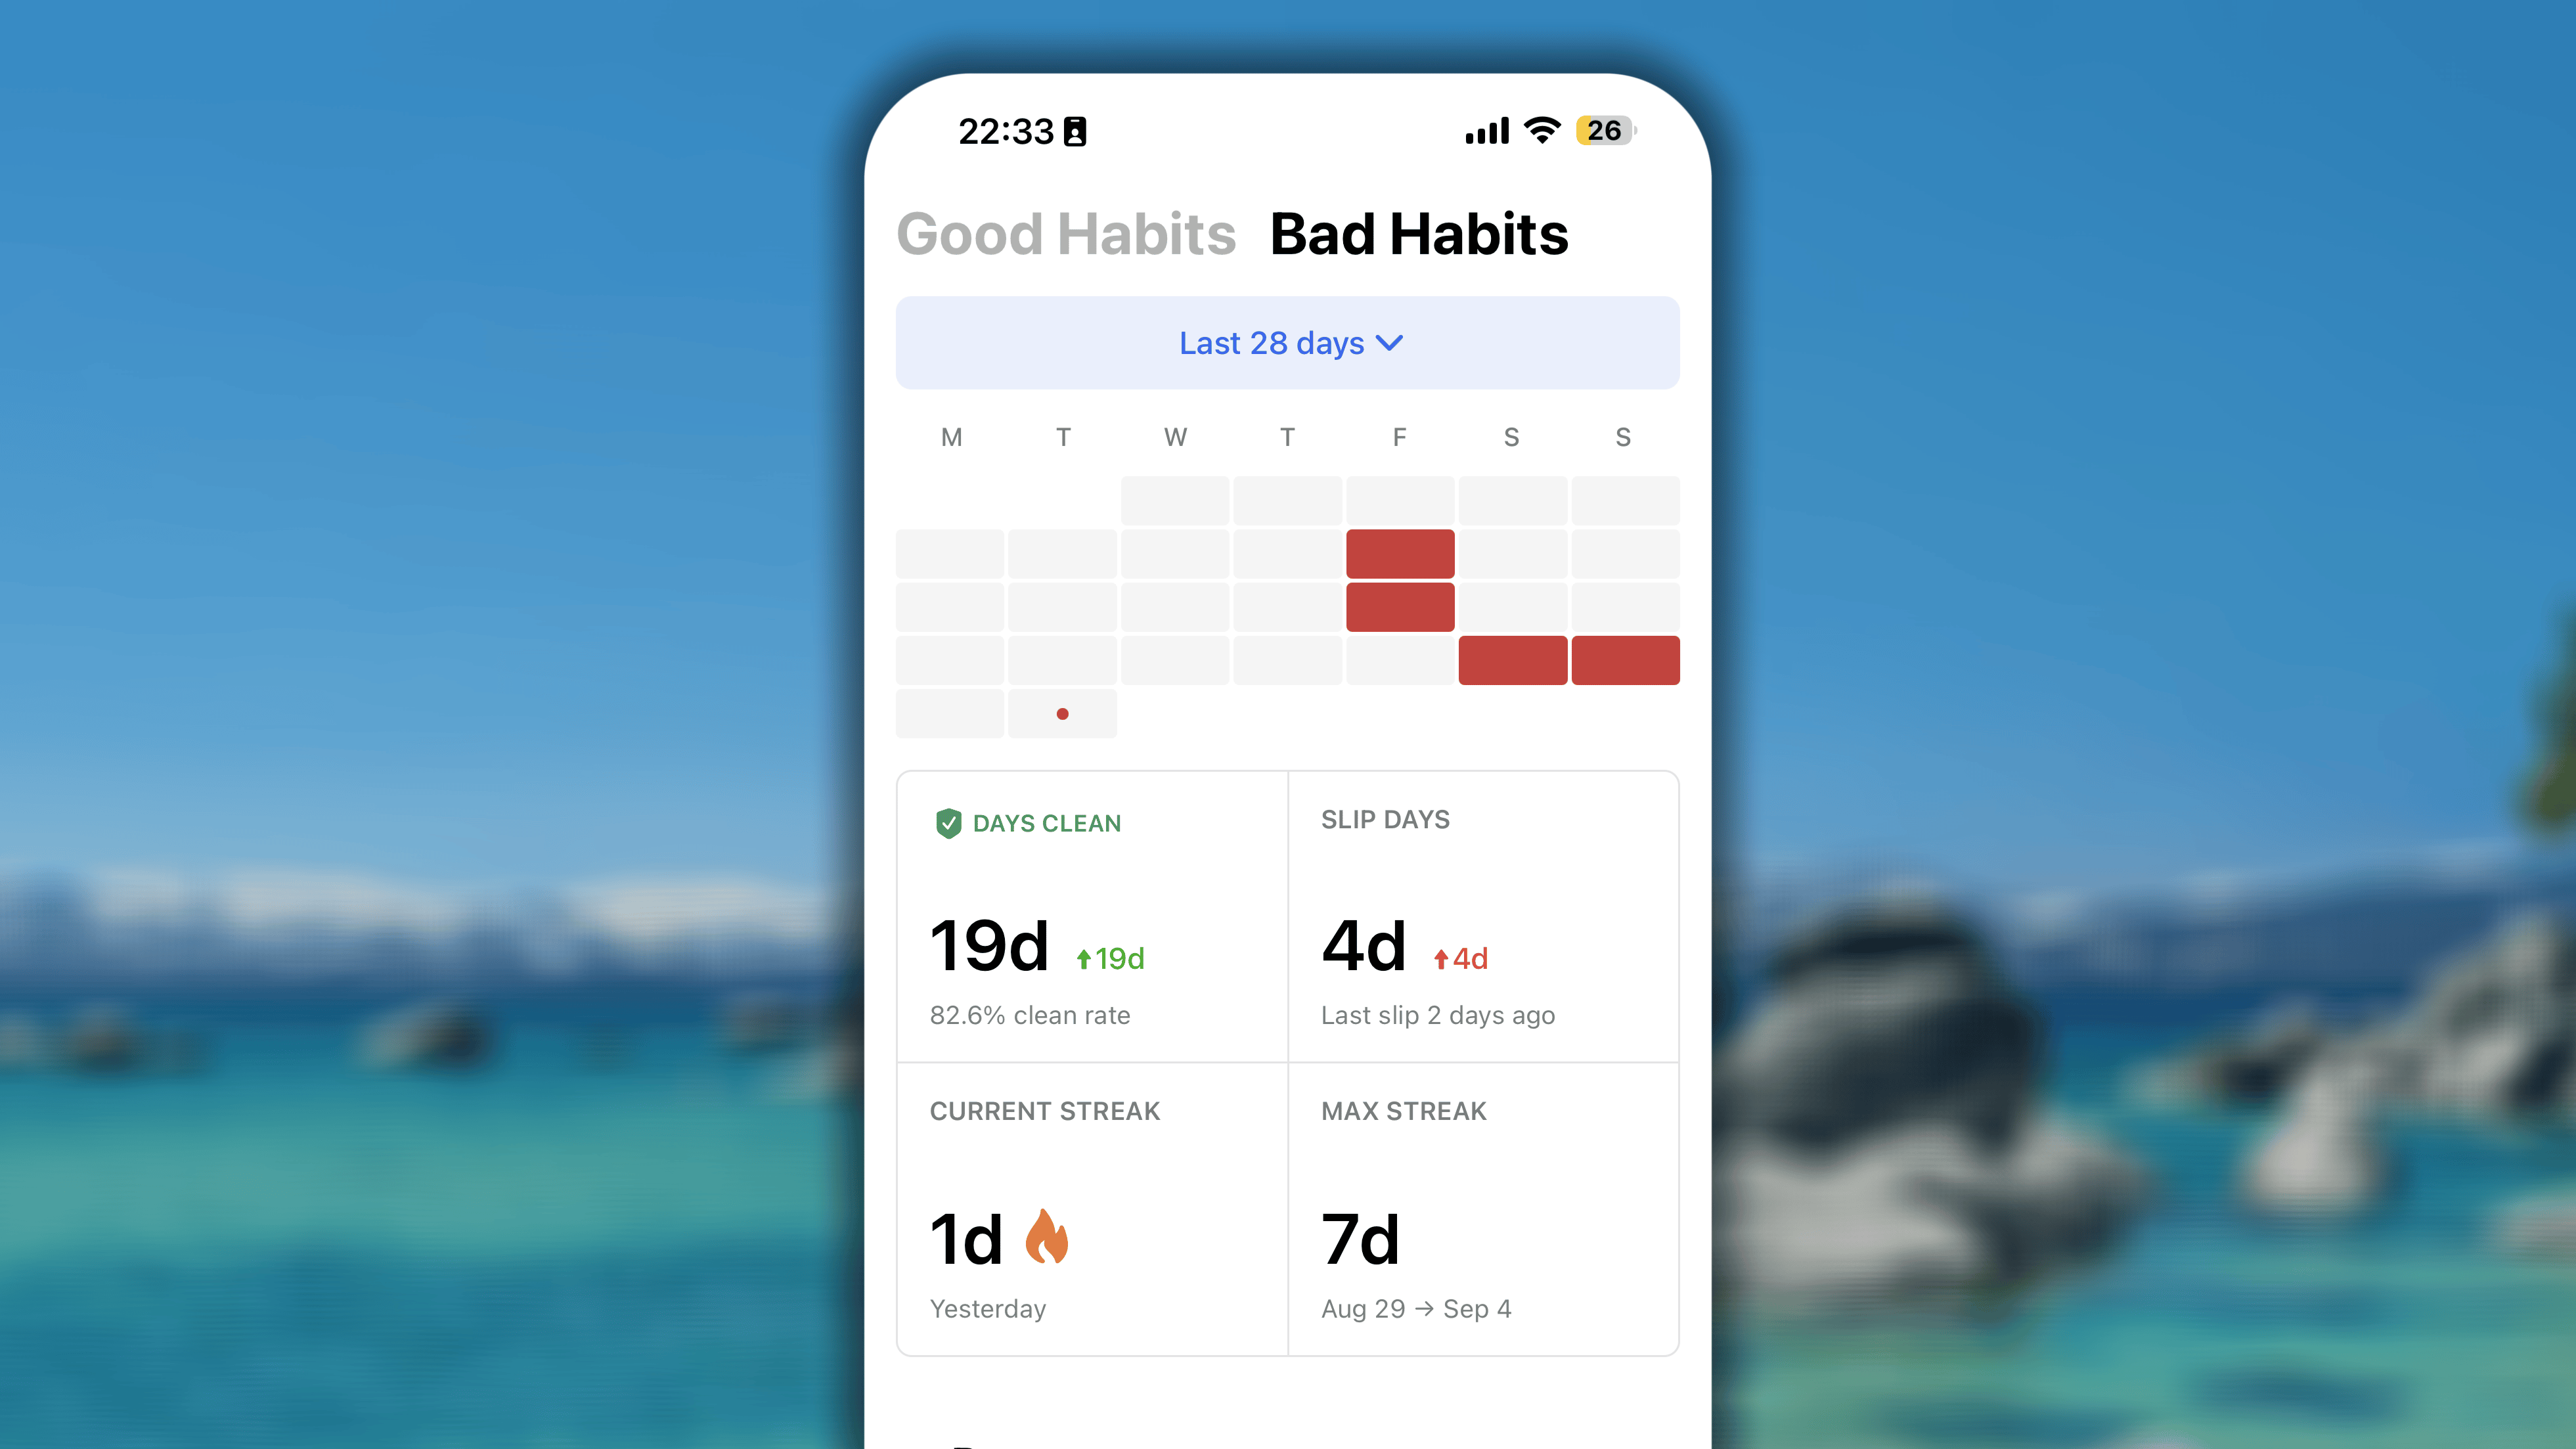
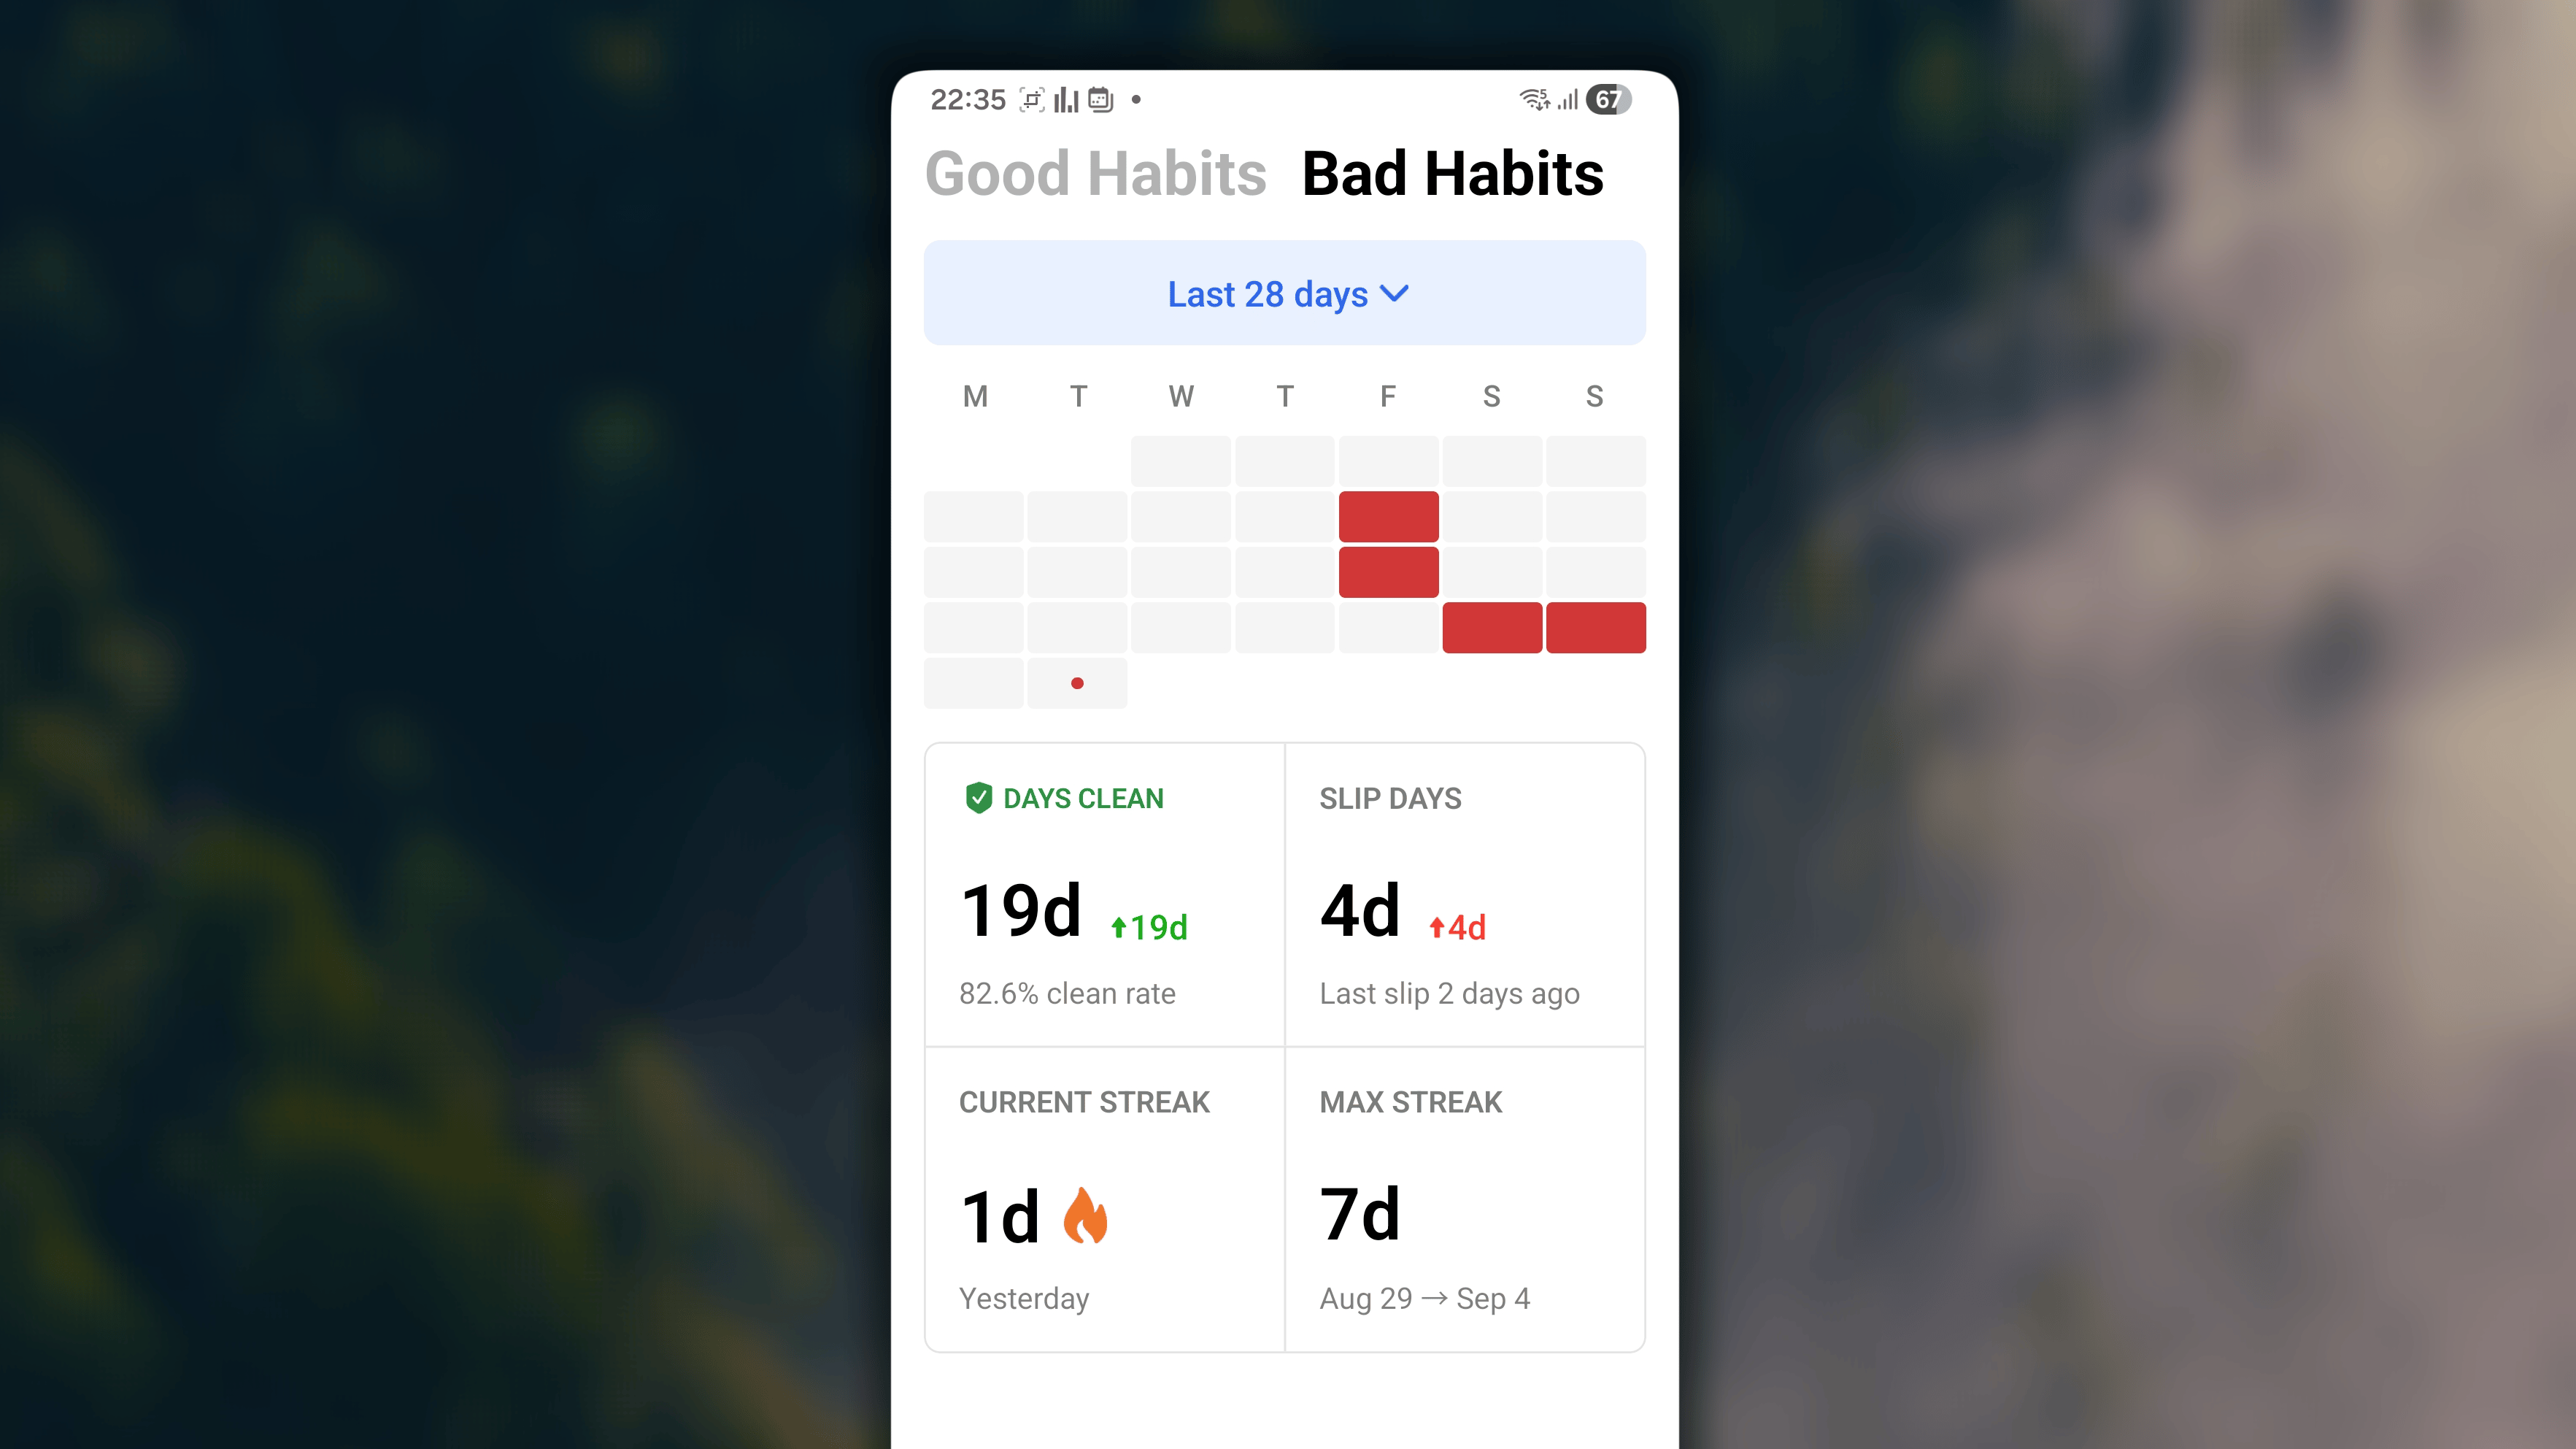
The Block Calendar
Instead of trying to fill this calendar with dark colors like in the “Good Habits” view, your goal here is to keep it as blank as possible. The light gray blocks represent your clean days.If you log a slip-up for a bad habit, that day’s block will instantly be colored solid red.This visual gives you an instant reality check. A red block isn’t something to feel guilty about; it is a data point to help you recognize when your slip-ups usually happen.The Core Indexes
Directly below the calendar is a breakdown of your consistency, neatly divided into four motivating metrics:- Days Clean: The total number of days you successfully avoided your bad habits entirely, accompanied by your overall “clean rate” percentage.
- Slip Days: The total number of days you have progress logs, even when the total logged value is still under the limitation, including a note on exactly how many days ago your last slip occurred.
- Current Streak: Your ongoing, unbroken run of clean days leading up to today, marked with a flame icon.
- Max Streak: Your all-time historical record for consecutive clean days.
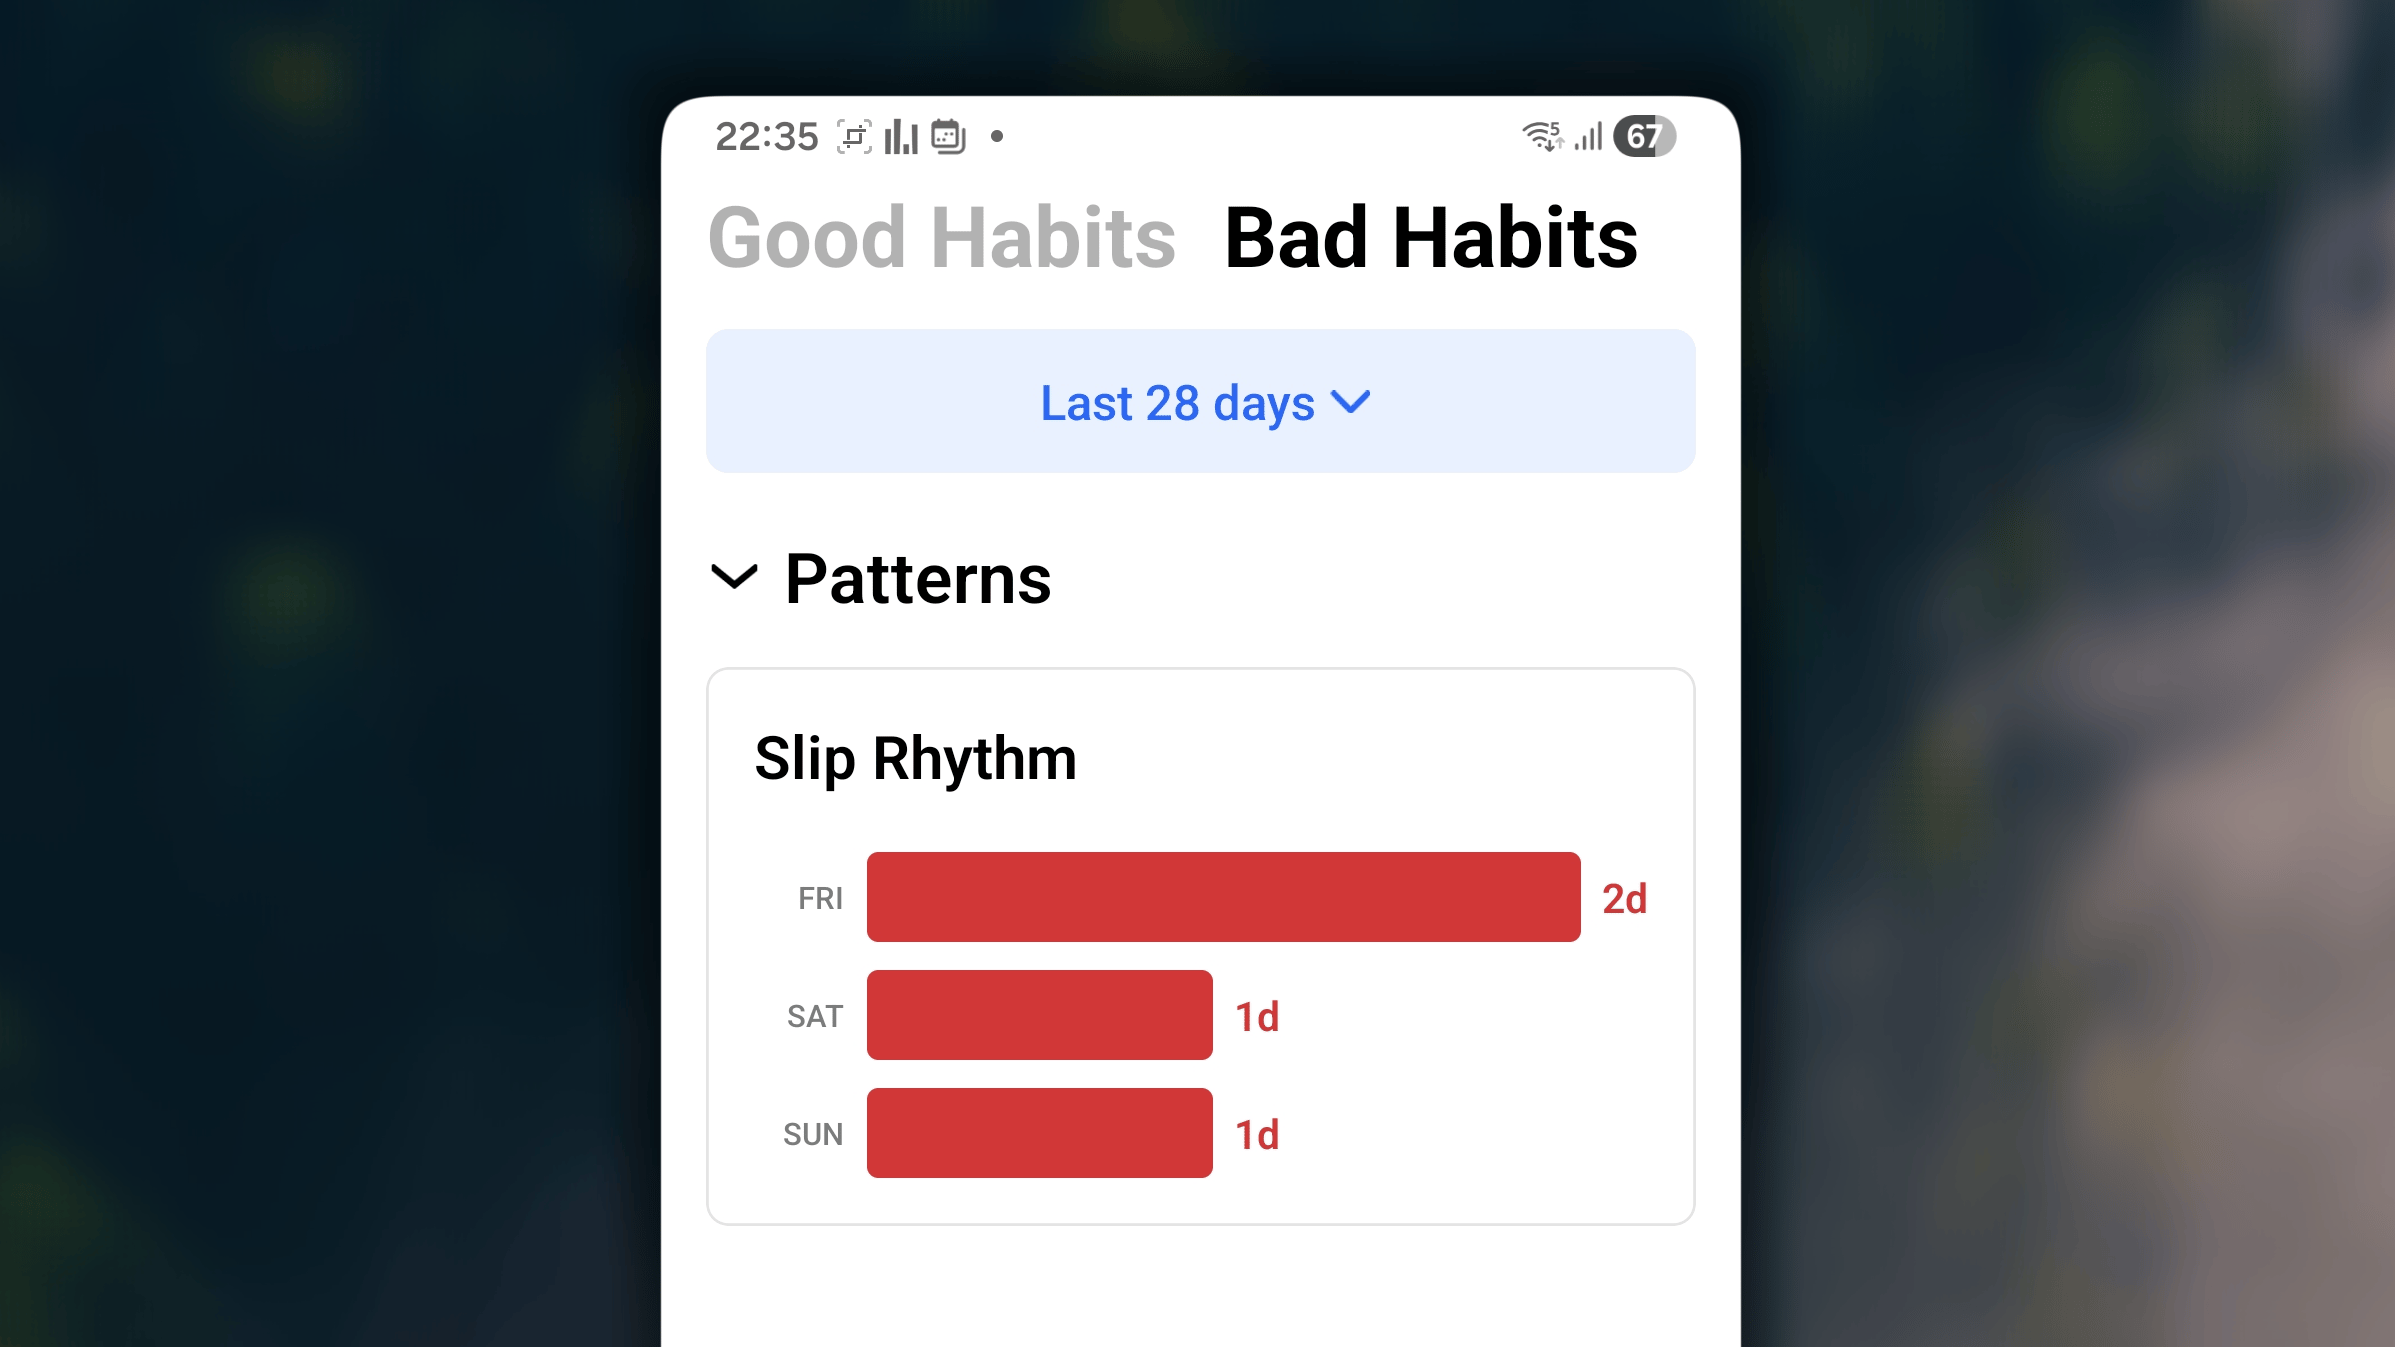
Patterns
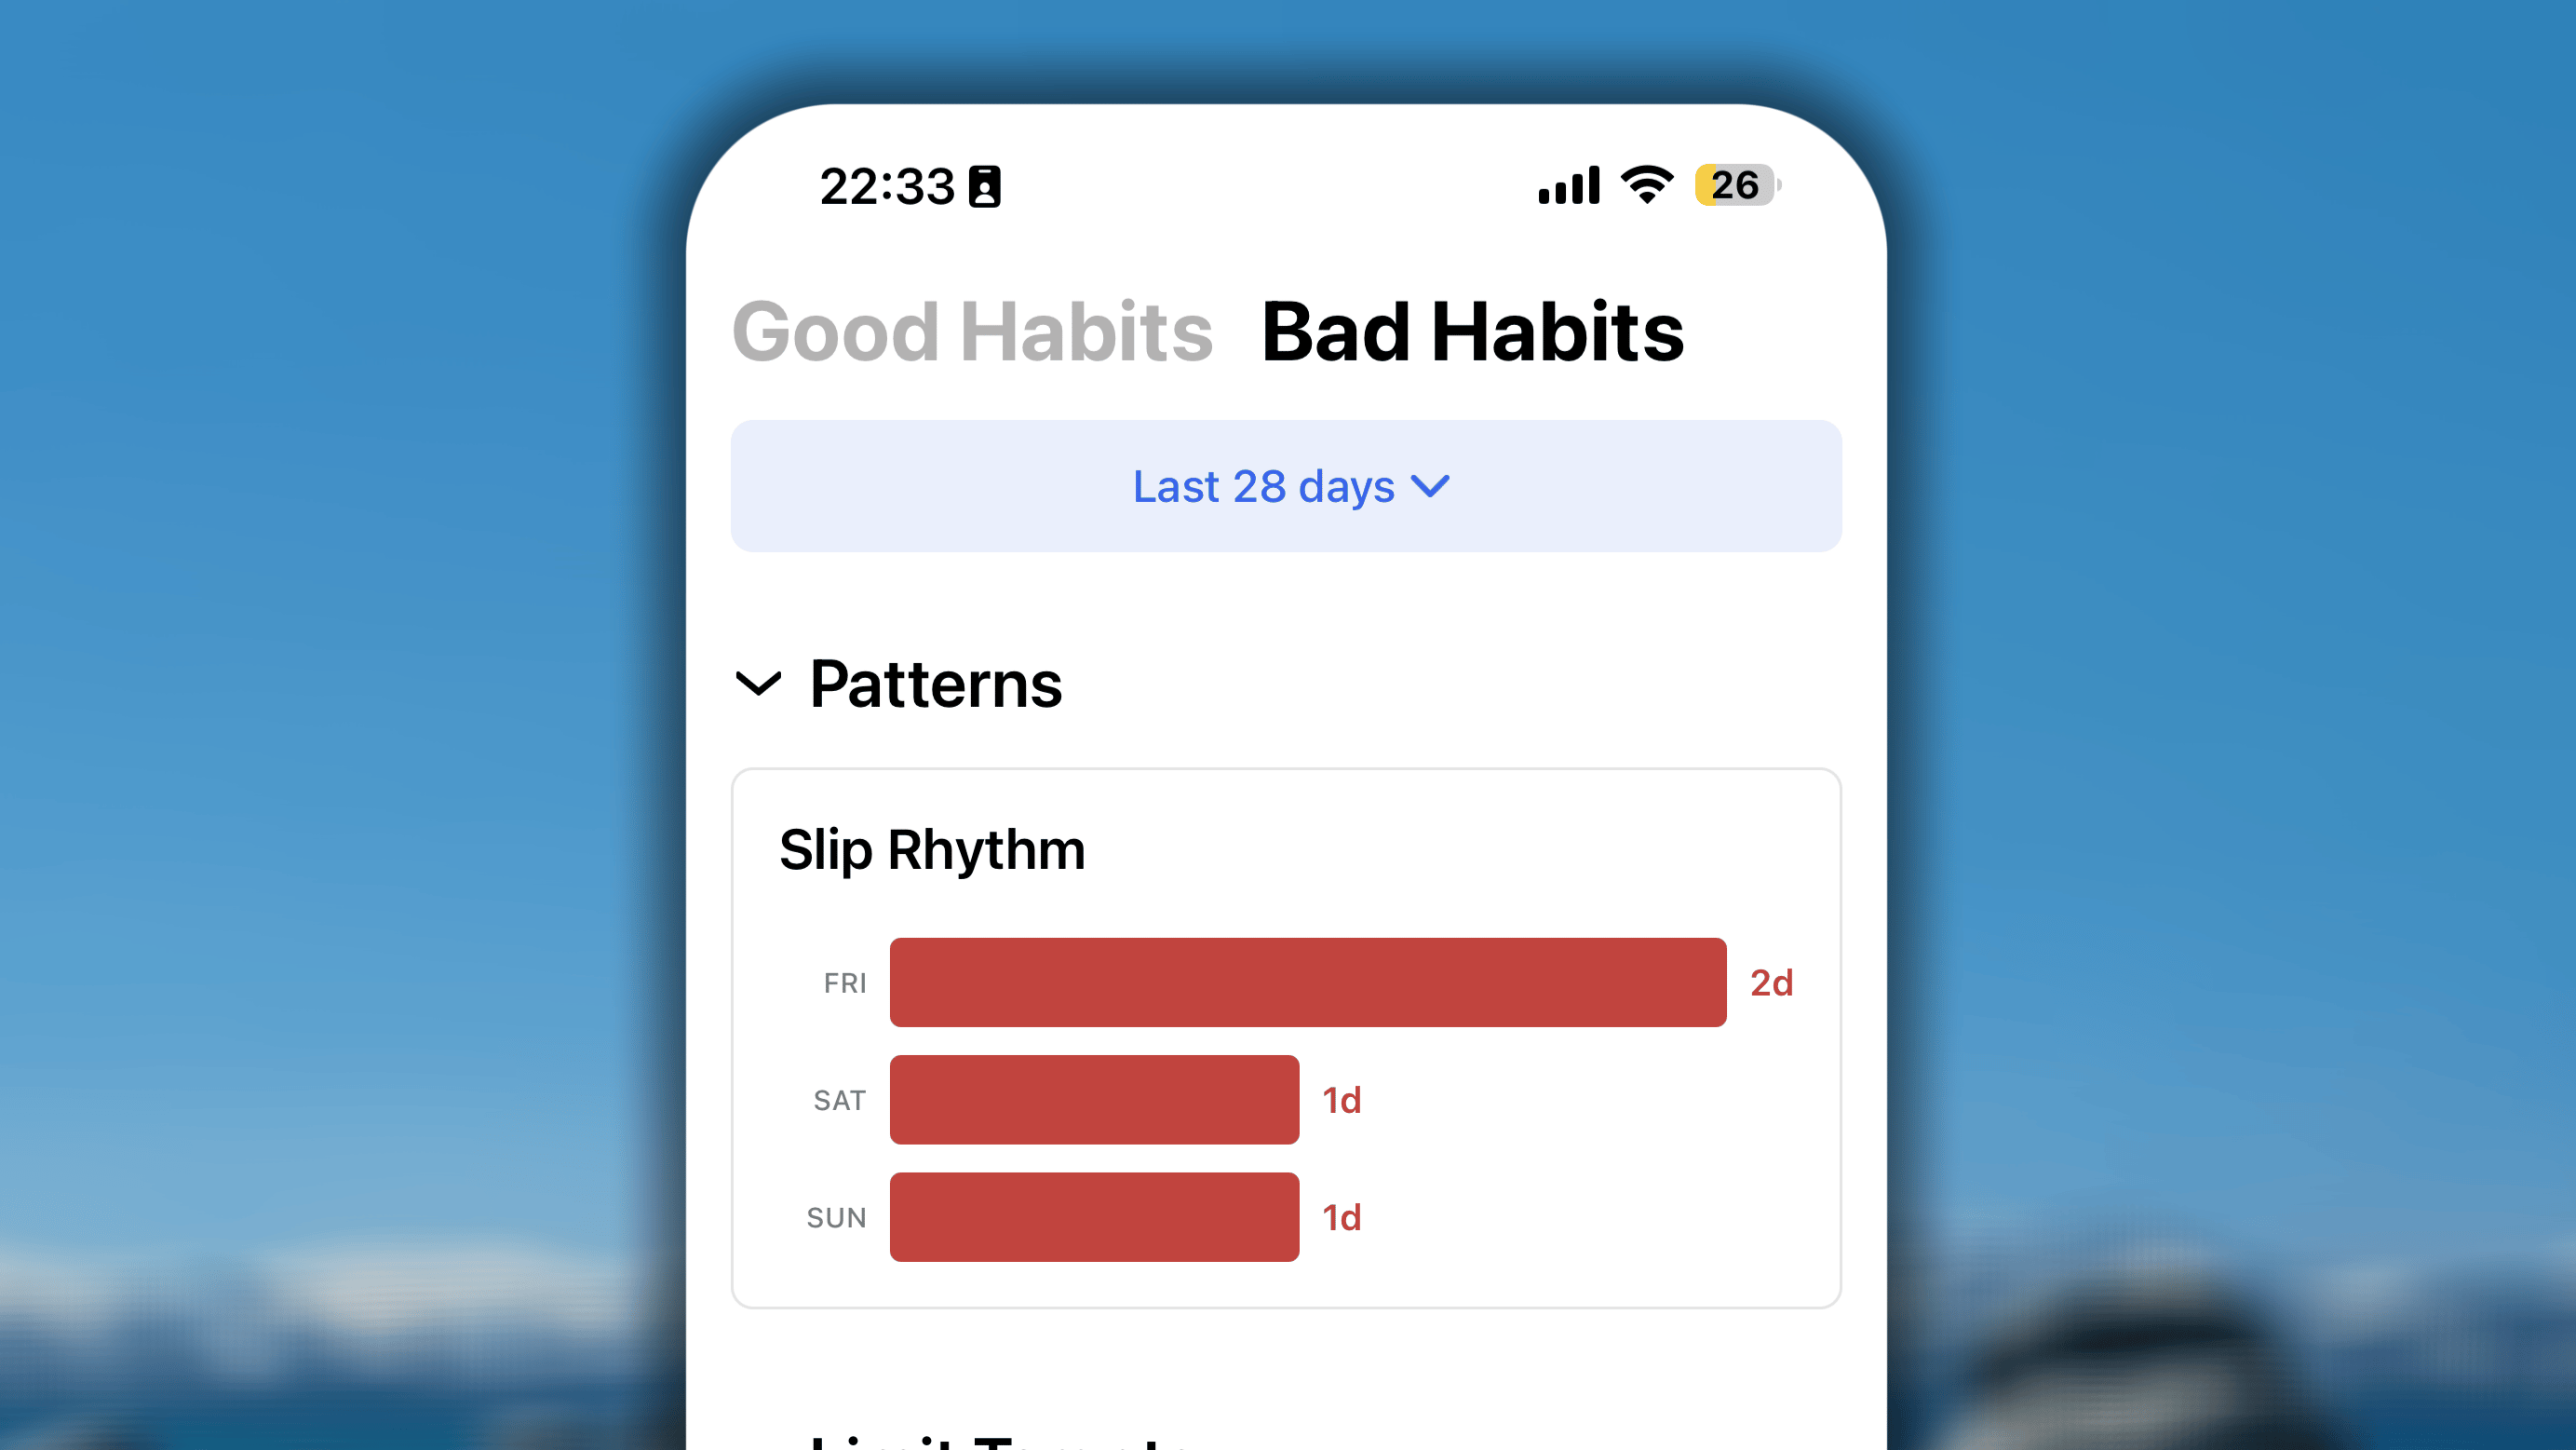
Limit Targets
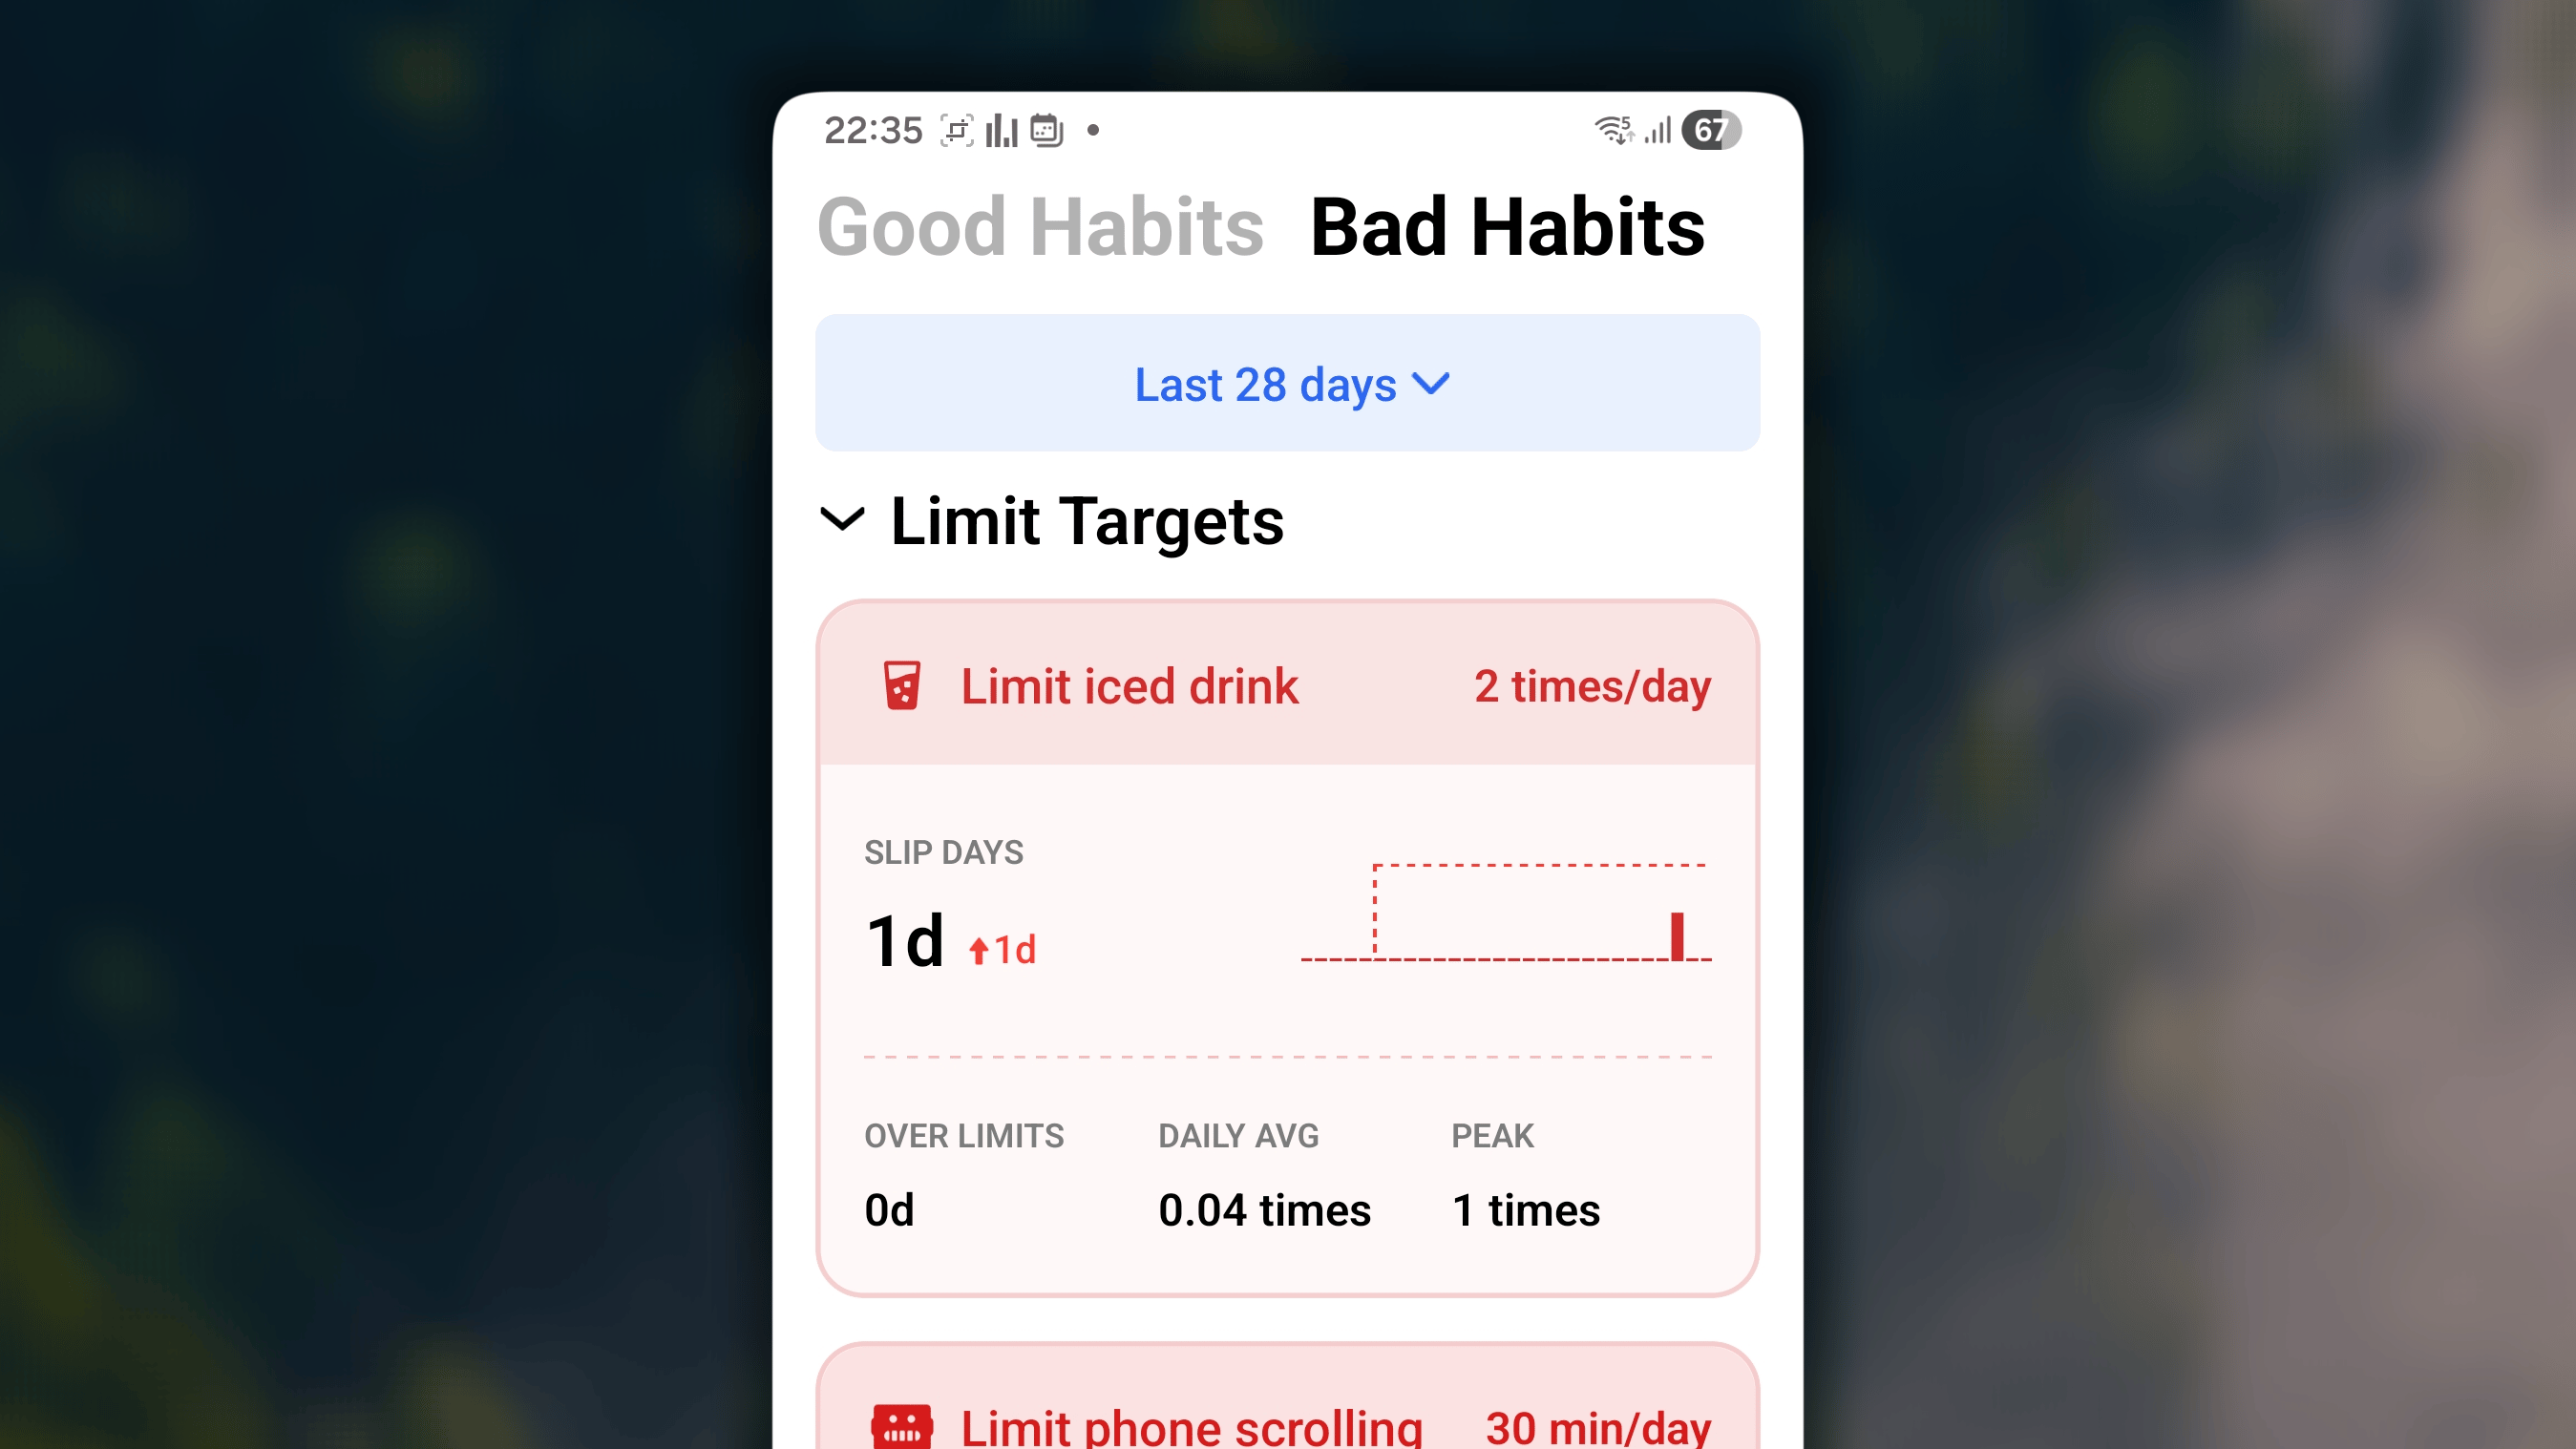
While the previous sections look at your overall effort, this section provides individualized report cards for each specific bad habit.Because Habitify allows you to set two different types of goals for negative routines—either practicing moderation or stopping completely—you will see two slightly different types of cards here depending on the habit.Limit-Type Habits
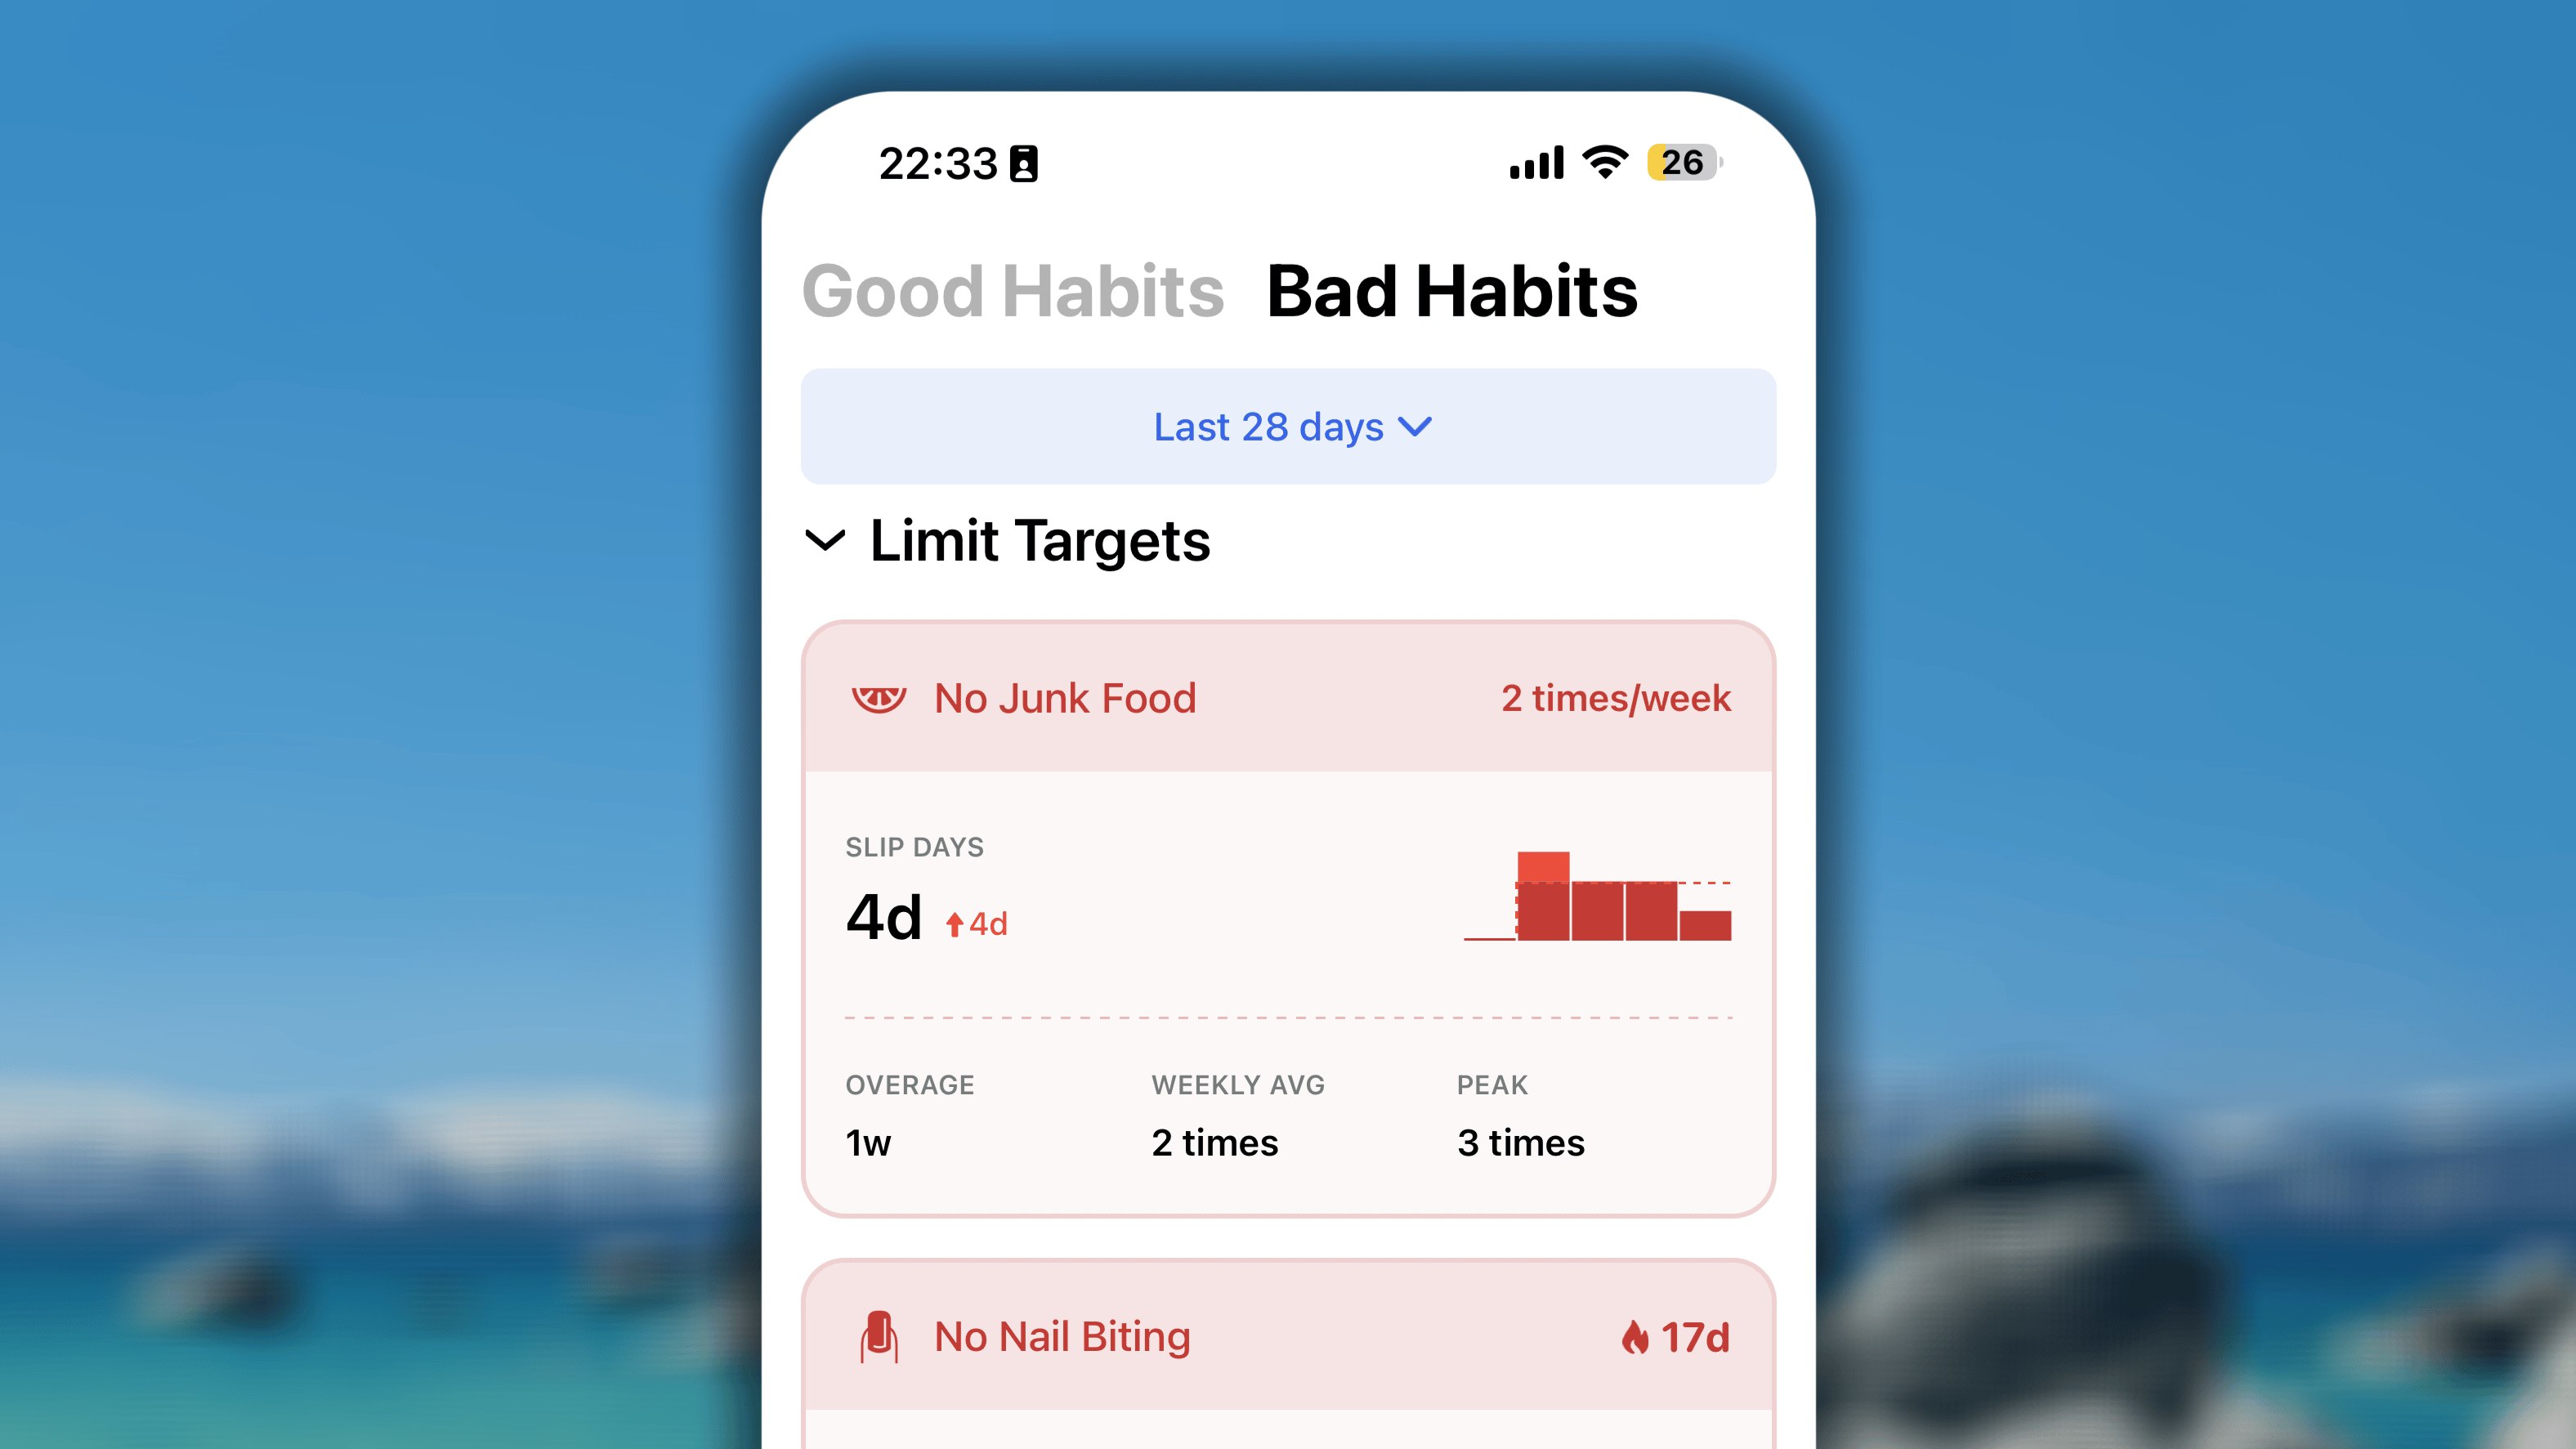
- The Header: Shows the habit’s name alongside the limitation you set for it.
- Slips & The Limitation Chart: Highlights how many days you “slipped” (having at least 1 progress log). Next to this is a column chart plotting your actual logs against a red dotted limitation line. Any column that breaks through that red line represents a slip.
- The Detail Breakdown: Summarizes your tracking with three metrics:
- Overage: The number of periods when you consumed or did beyond your allowed limit.
- Average: Your actual average volume per period (daily, weekly, or monthly).
- Peak: Your absolute highest amount logged during a single period.
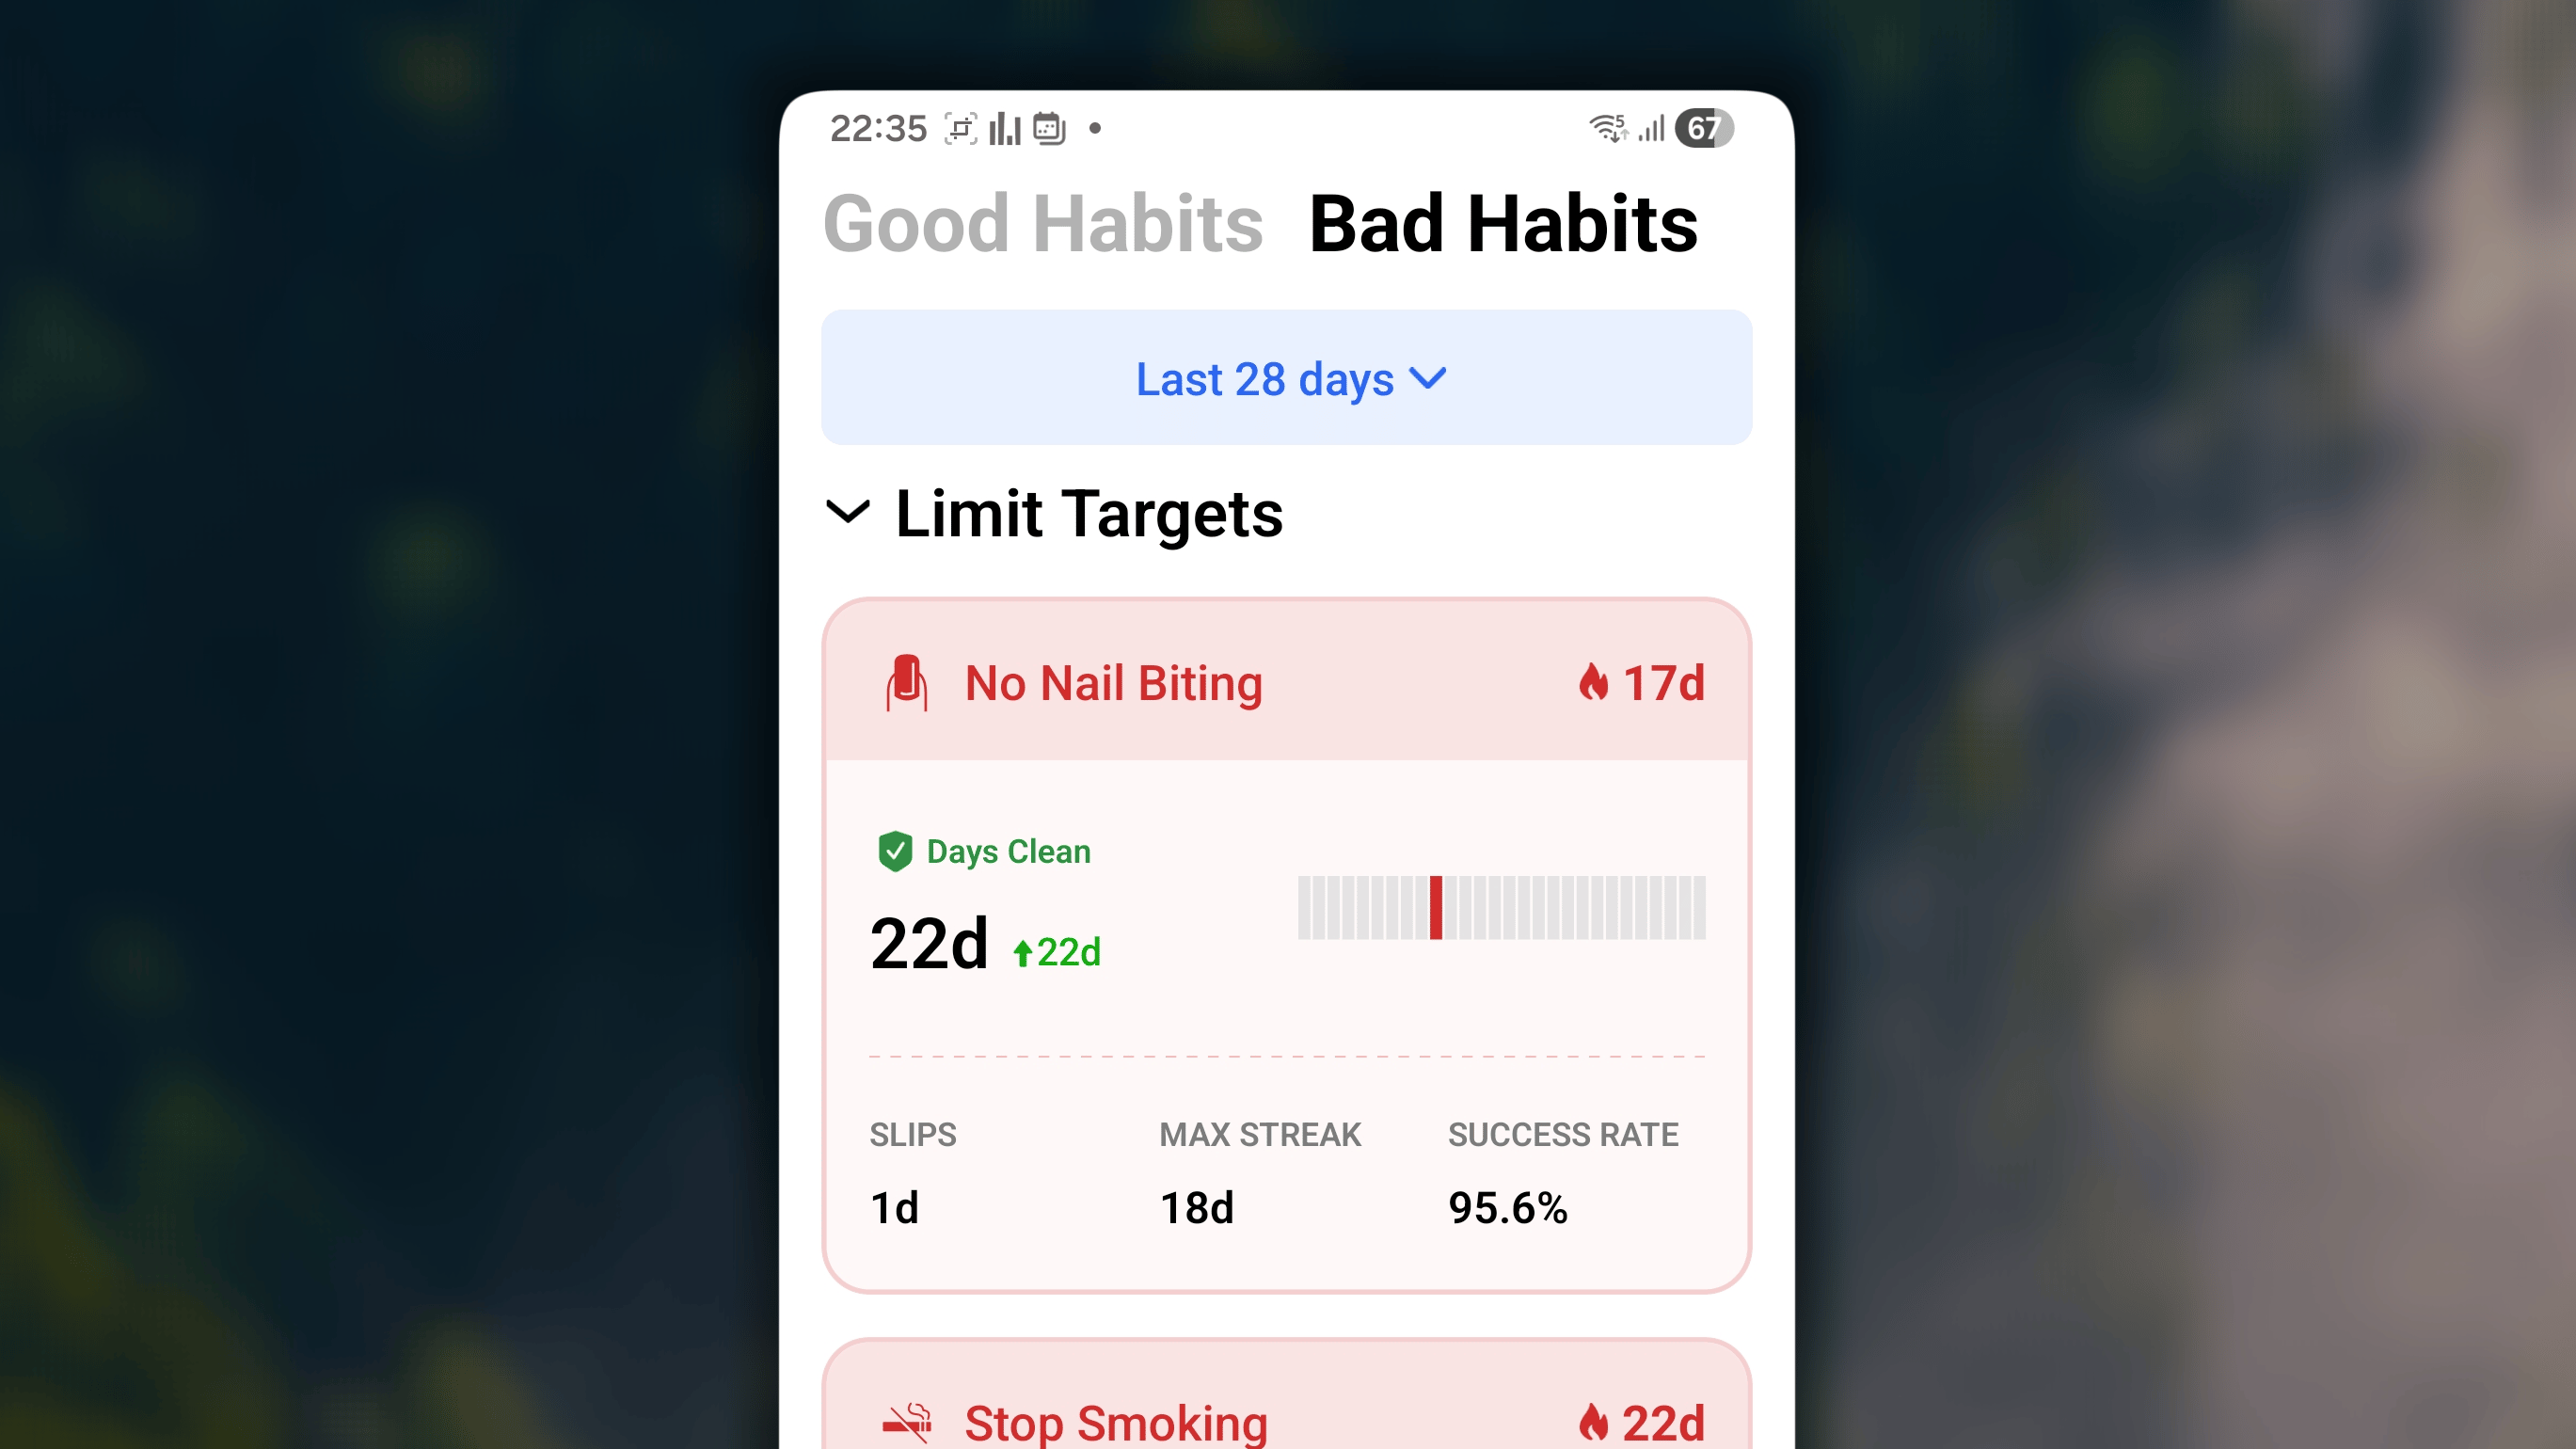
Quit-Type Habits
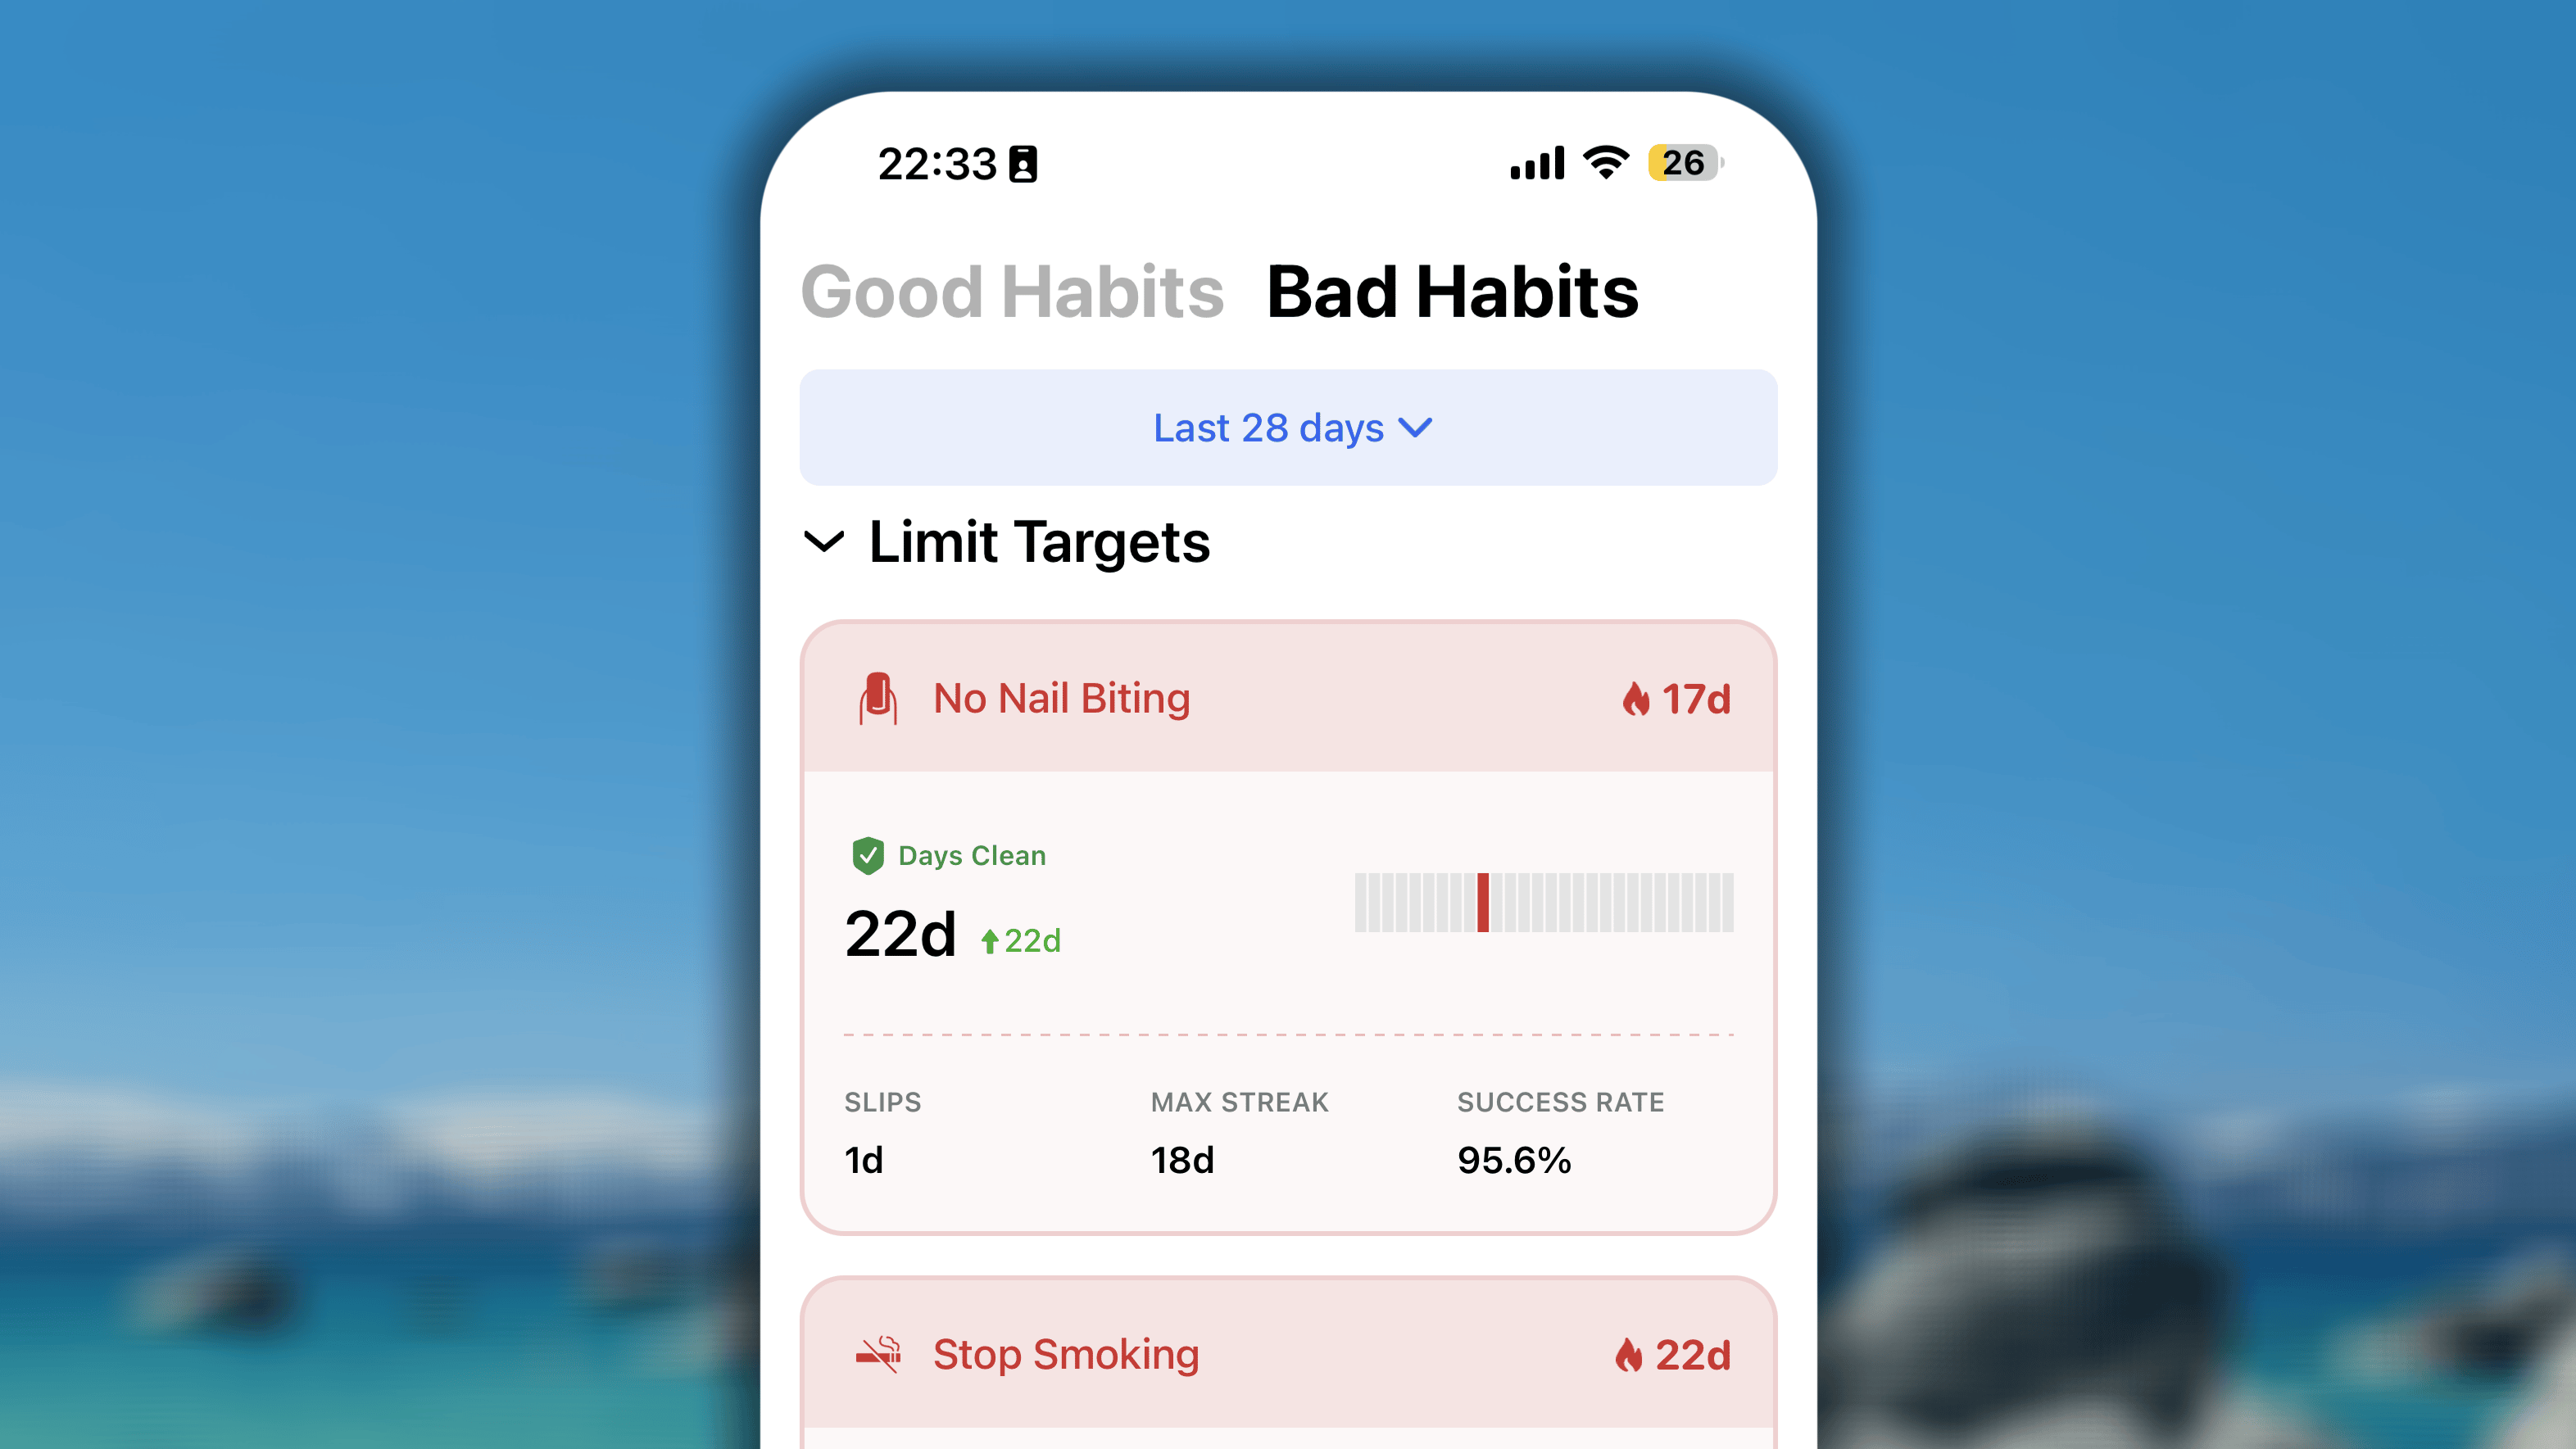
- The Header: Displays the habit’s name next to a flame icon highlighting your current active streak of clean days.
- Days Clean & The Chain: Prominently shows your total clean days (day with zero progress logs) for the period, alongside a visual progress chain. In the progress chain, your clean days remain clear, while any slip days instantly stand out as vertical red lines breaking the chain.
- The Detail Breakdown: Summarizes your effort by showing:
- Slips: a number of days you give in the bad habit
- Max Streak: all-time longest run of clean days
- Success Rate: percentage of clean days over the total number of days counted in the selected time range.
Asking Habi about Your Progress
From the Progress view, tap the chat icon in the bottom-right corner to open a conversation with Habi, your AI habit assistant.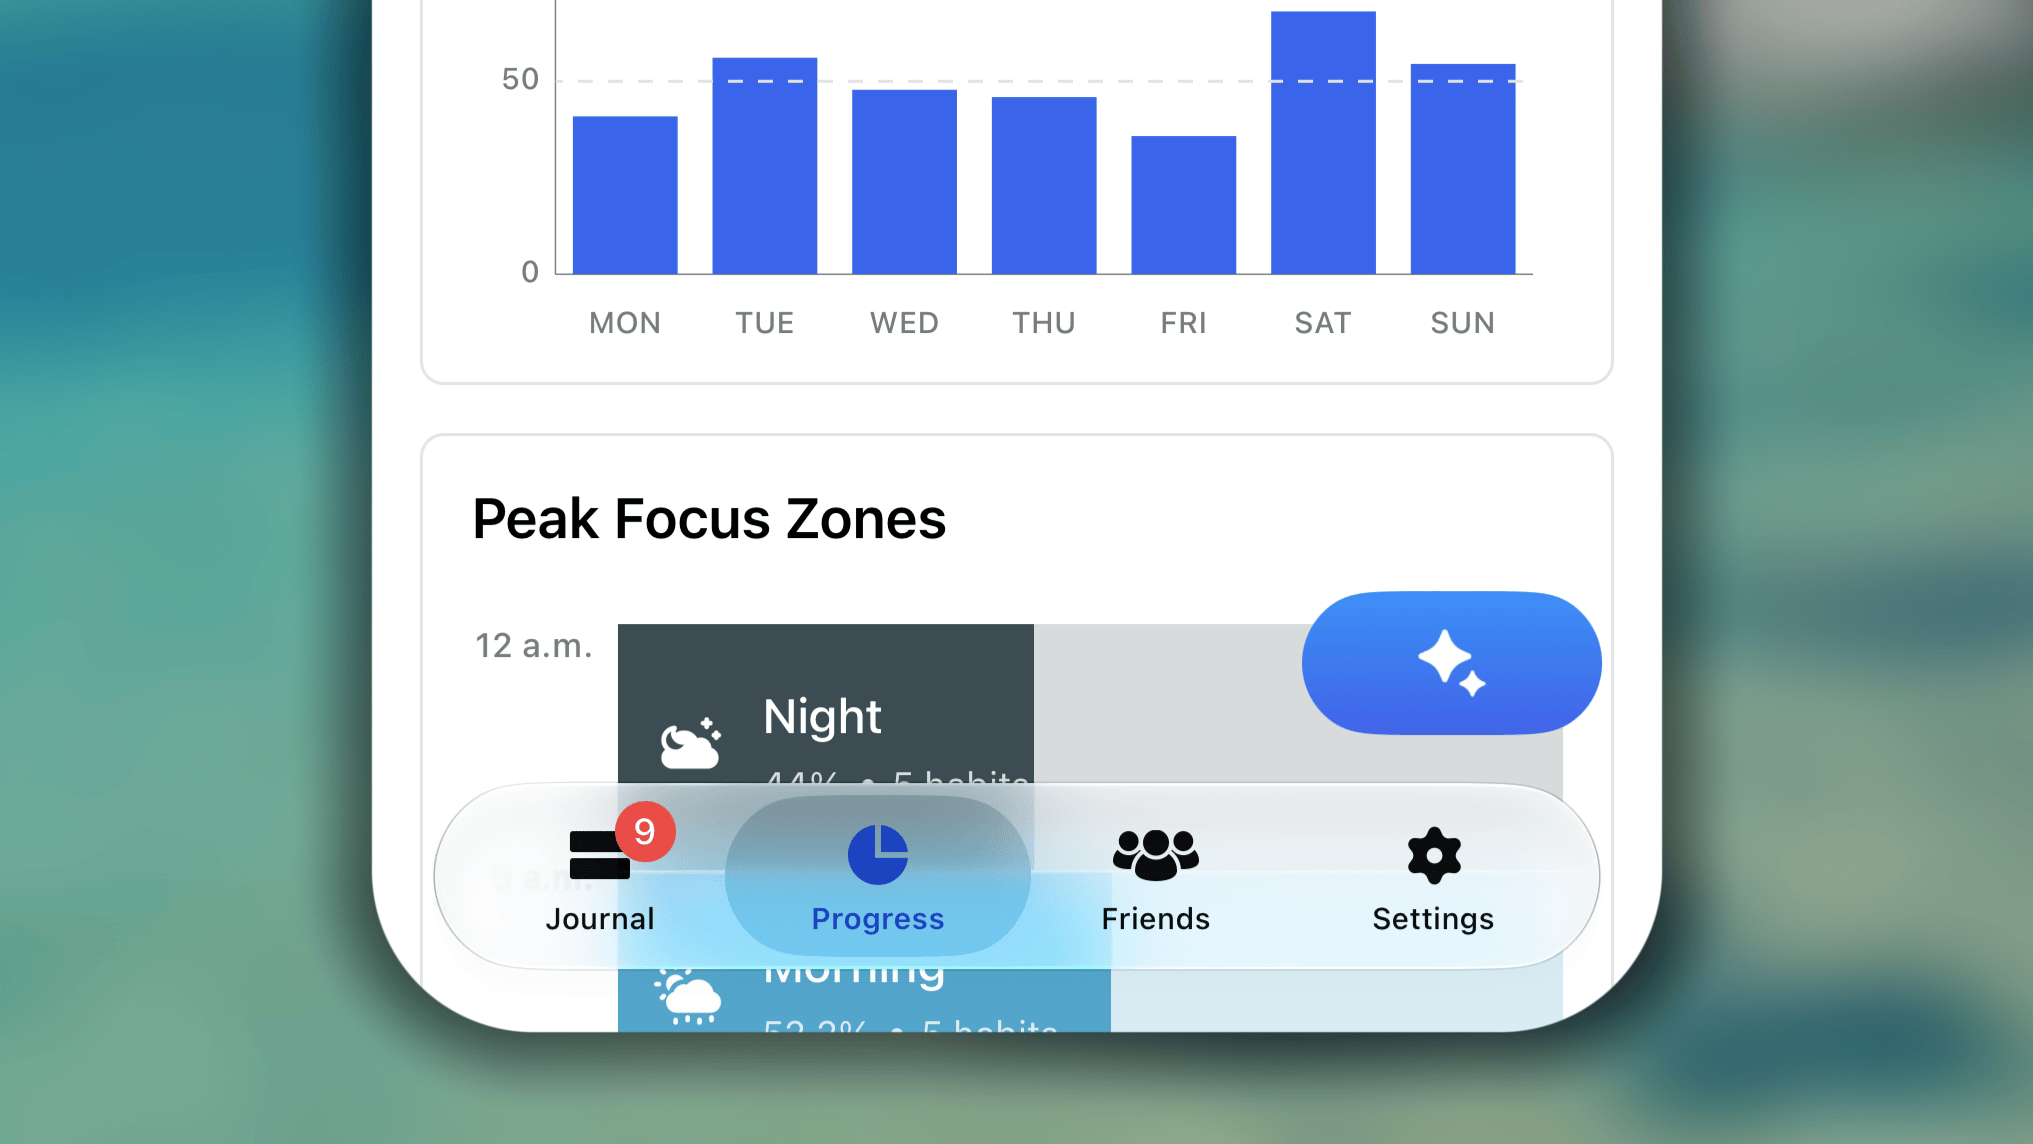
Progress on iPhone Duo
When your iPhone Duo is folded, Progress looks the same as it does on a standard iPhone. The extra space comes when you unfold the device and hold it horizontally.Below is a short video for the preview of Progress on iPhone duo:Instead of stacking everything in one long column, Progress uses the wider screen to put more on each row. Sections like Patterns show their charts next to each other, so Weekly Rhythm, Peak Focus Zones, and Missed Habits appear together and you can compare them without scrolling down.The Areas section works the same way, with your Area cards in a row. Your habits are shown as cards in a two-column grid, so you can see twice as many habits at once and compare their scores side by side. This gives you a fuller picture of your progress in fewer scrolls.