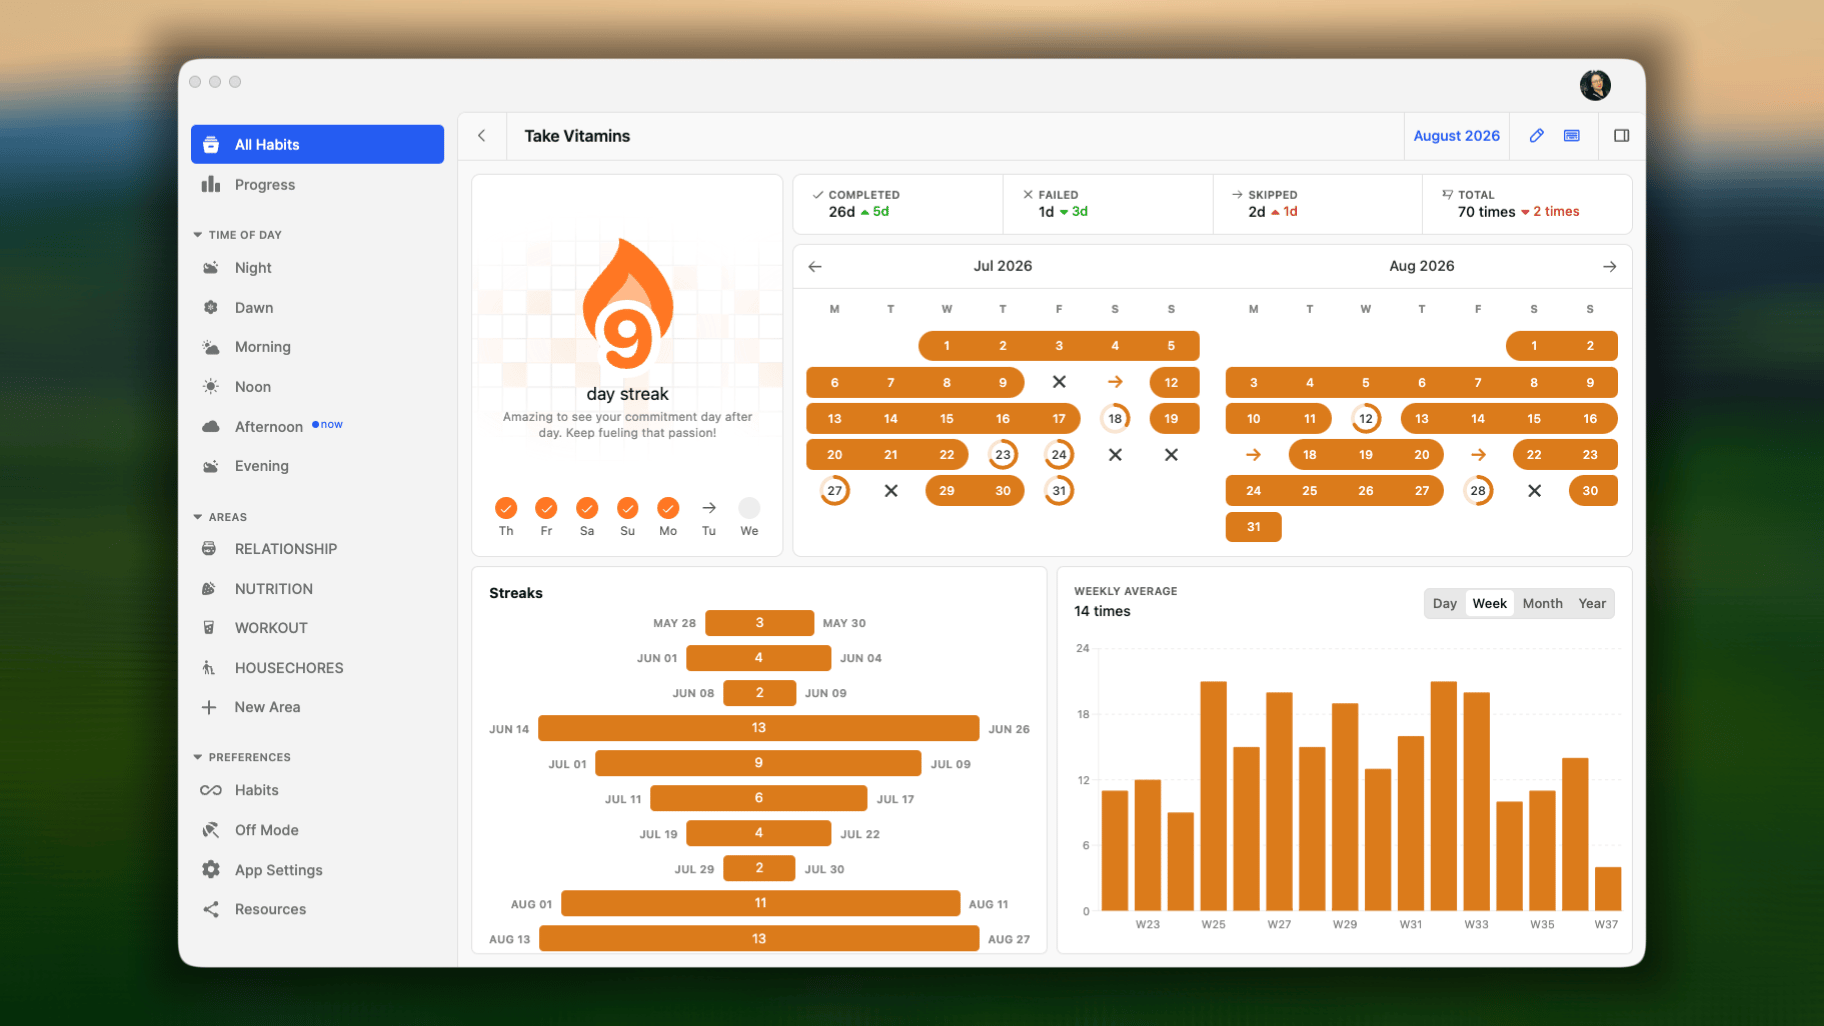

- iOS
- Android
- Website & Desktop
Good habit’s single progress
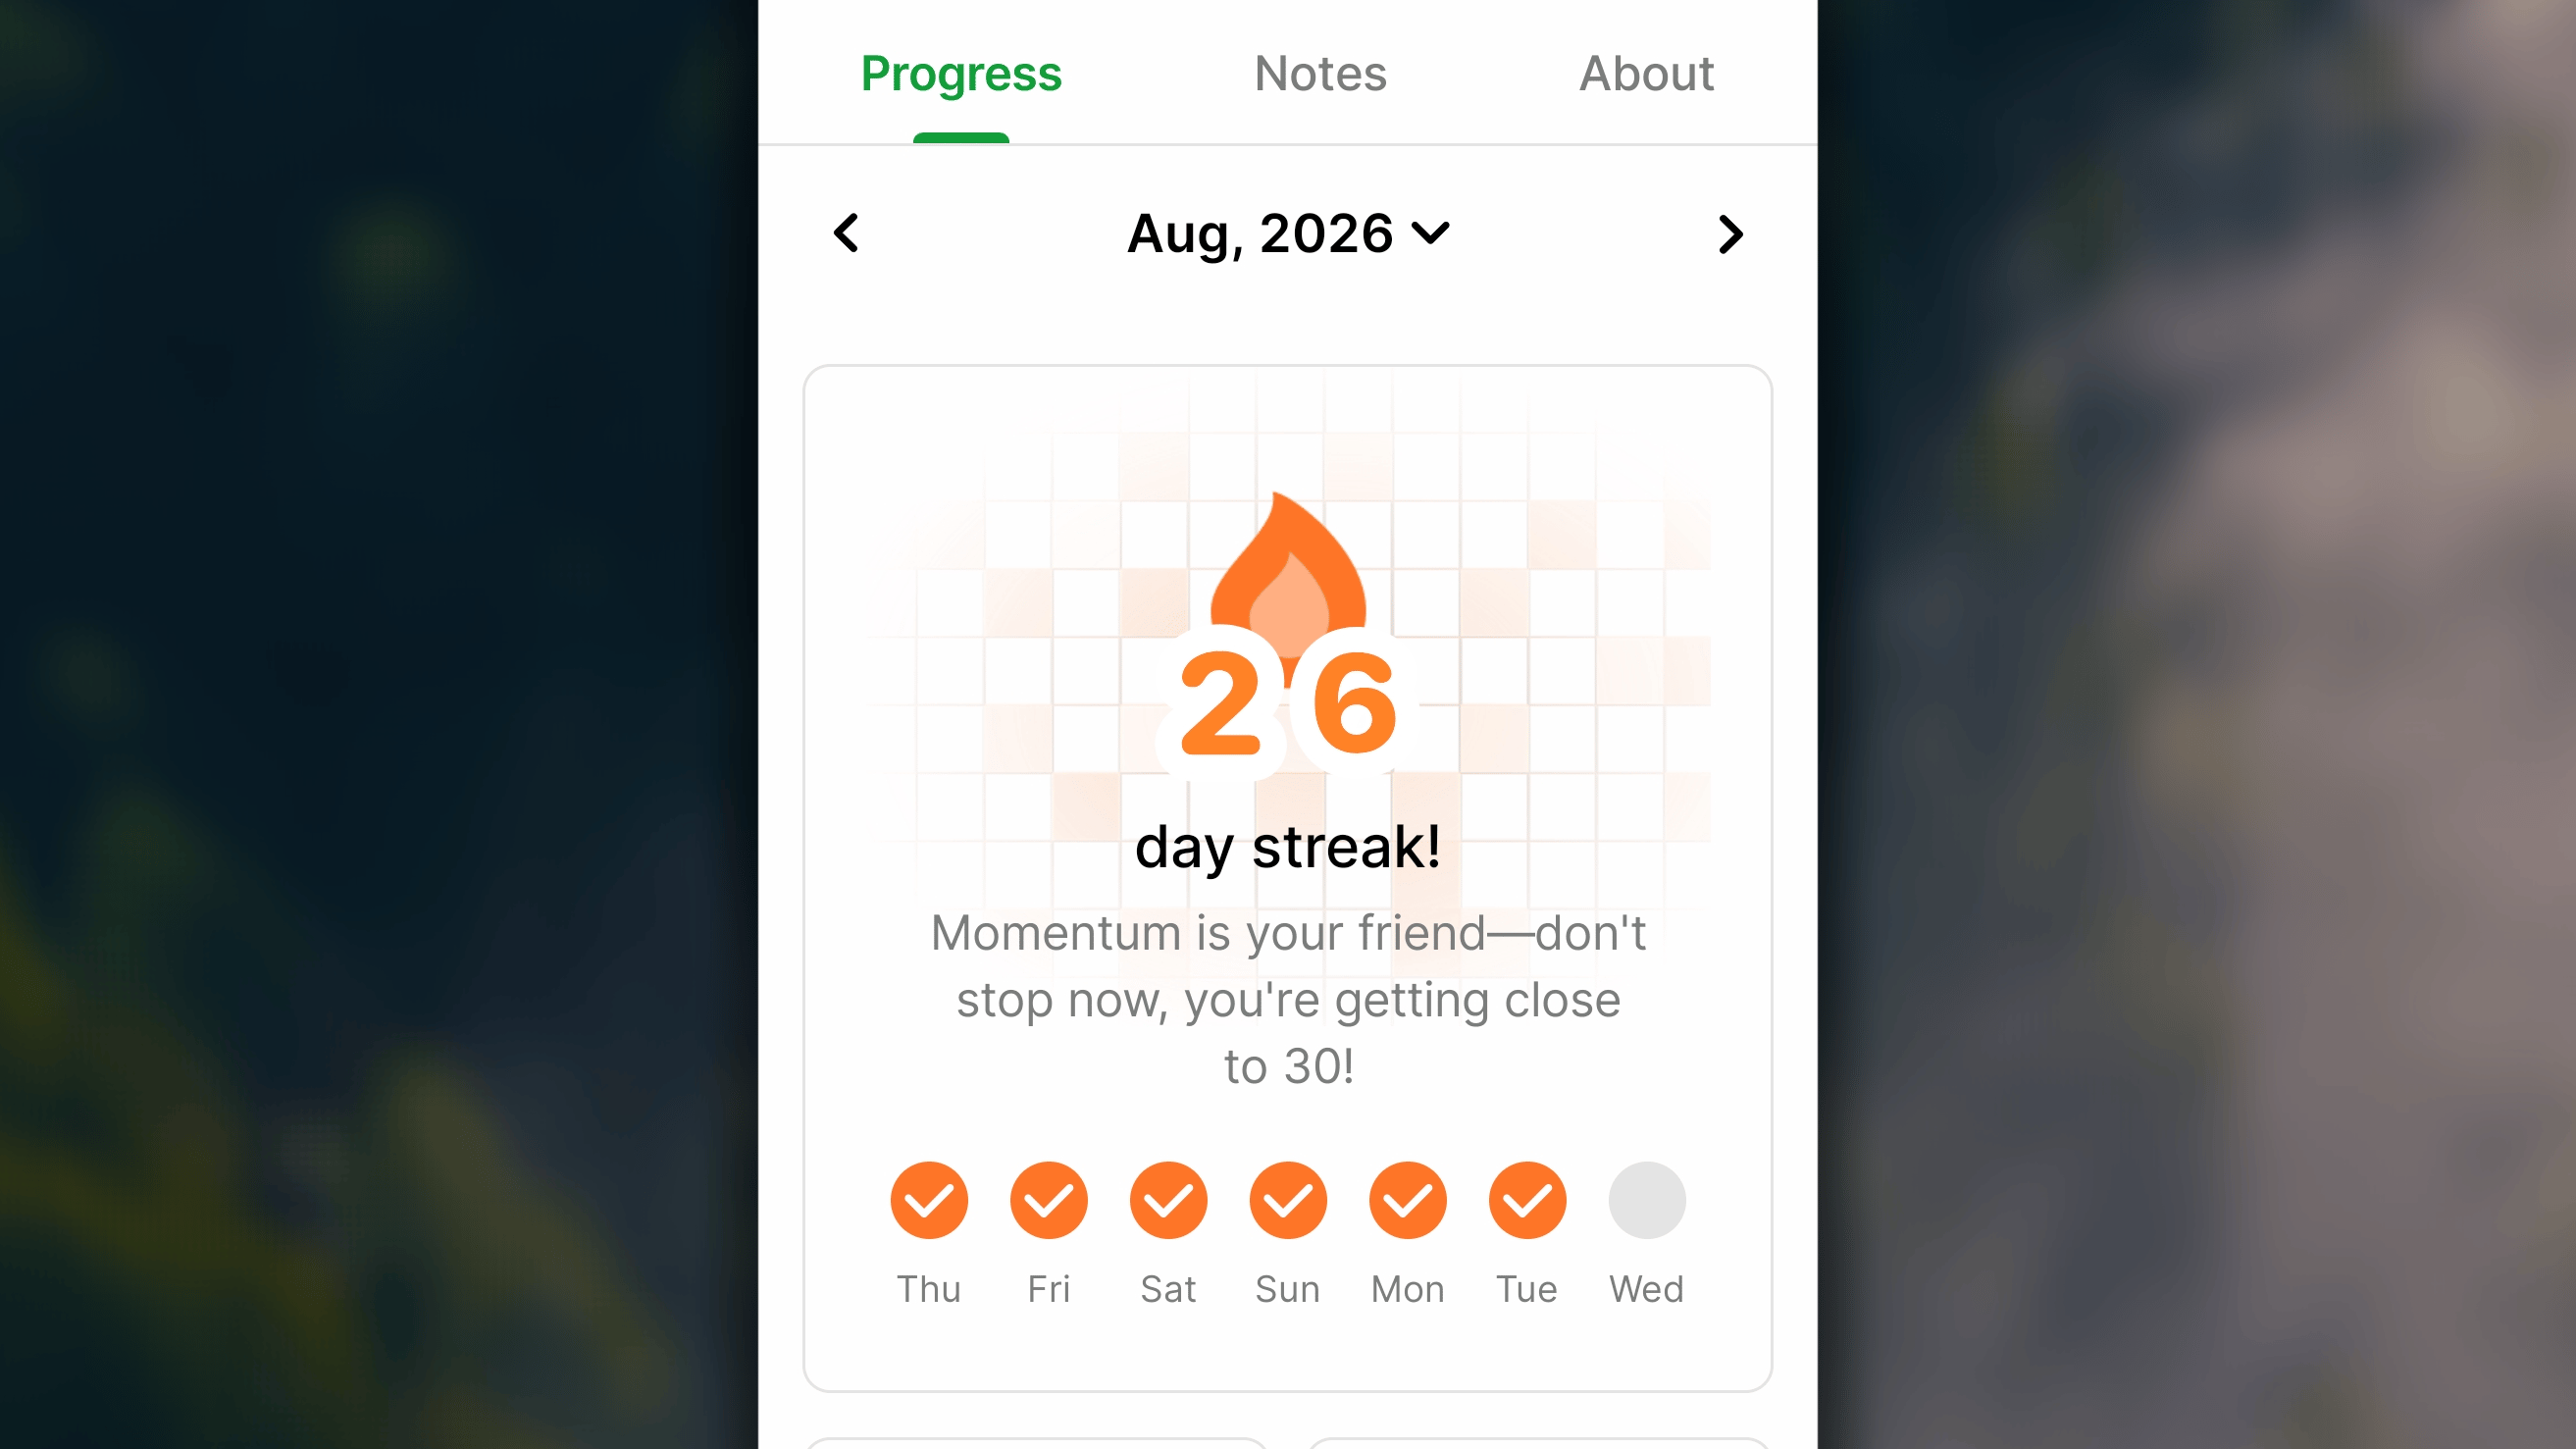
Current streak
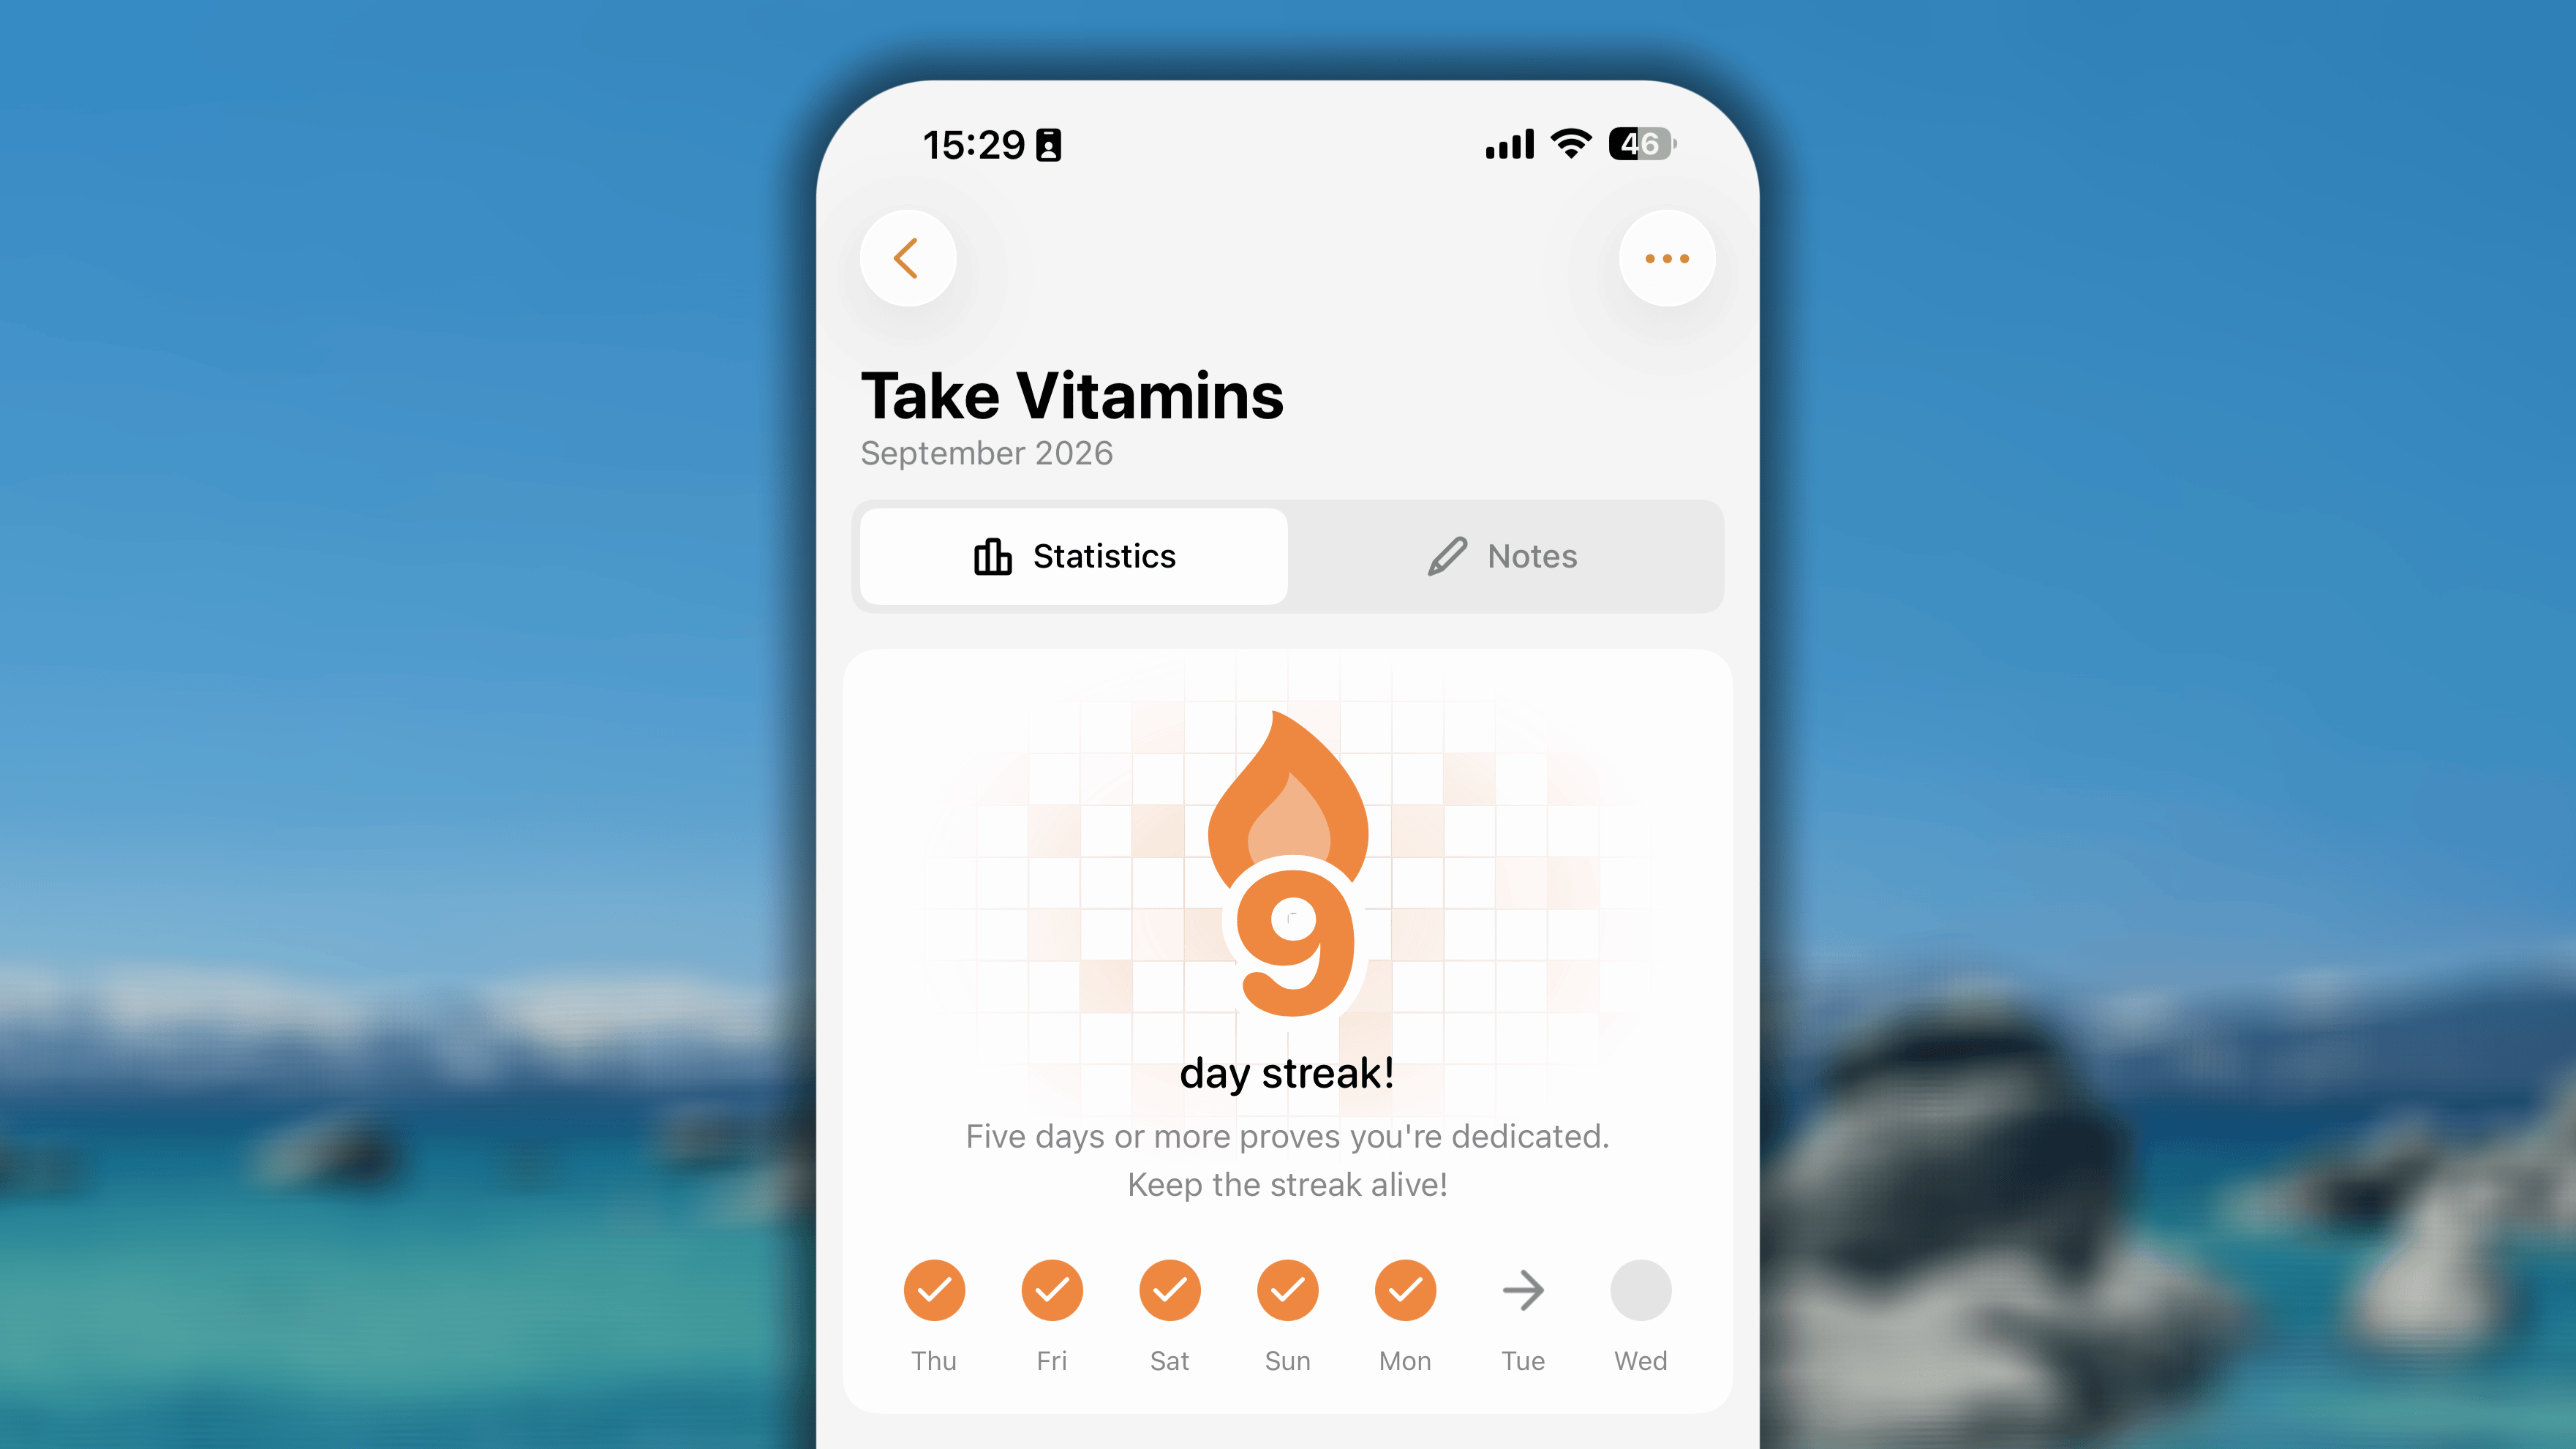
- For the habit with a per-day goal: your streak increases when you complete your habit for the day it is scheduled to repeat. Below your streak, you can see the progress of the last 7 days.
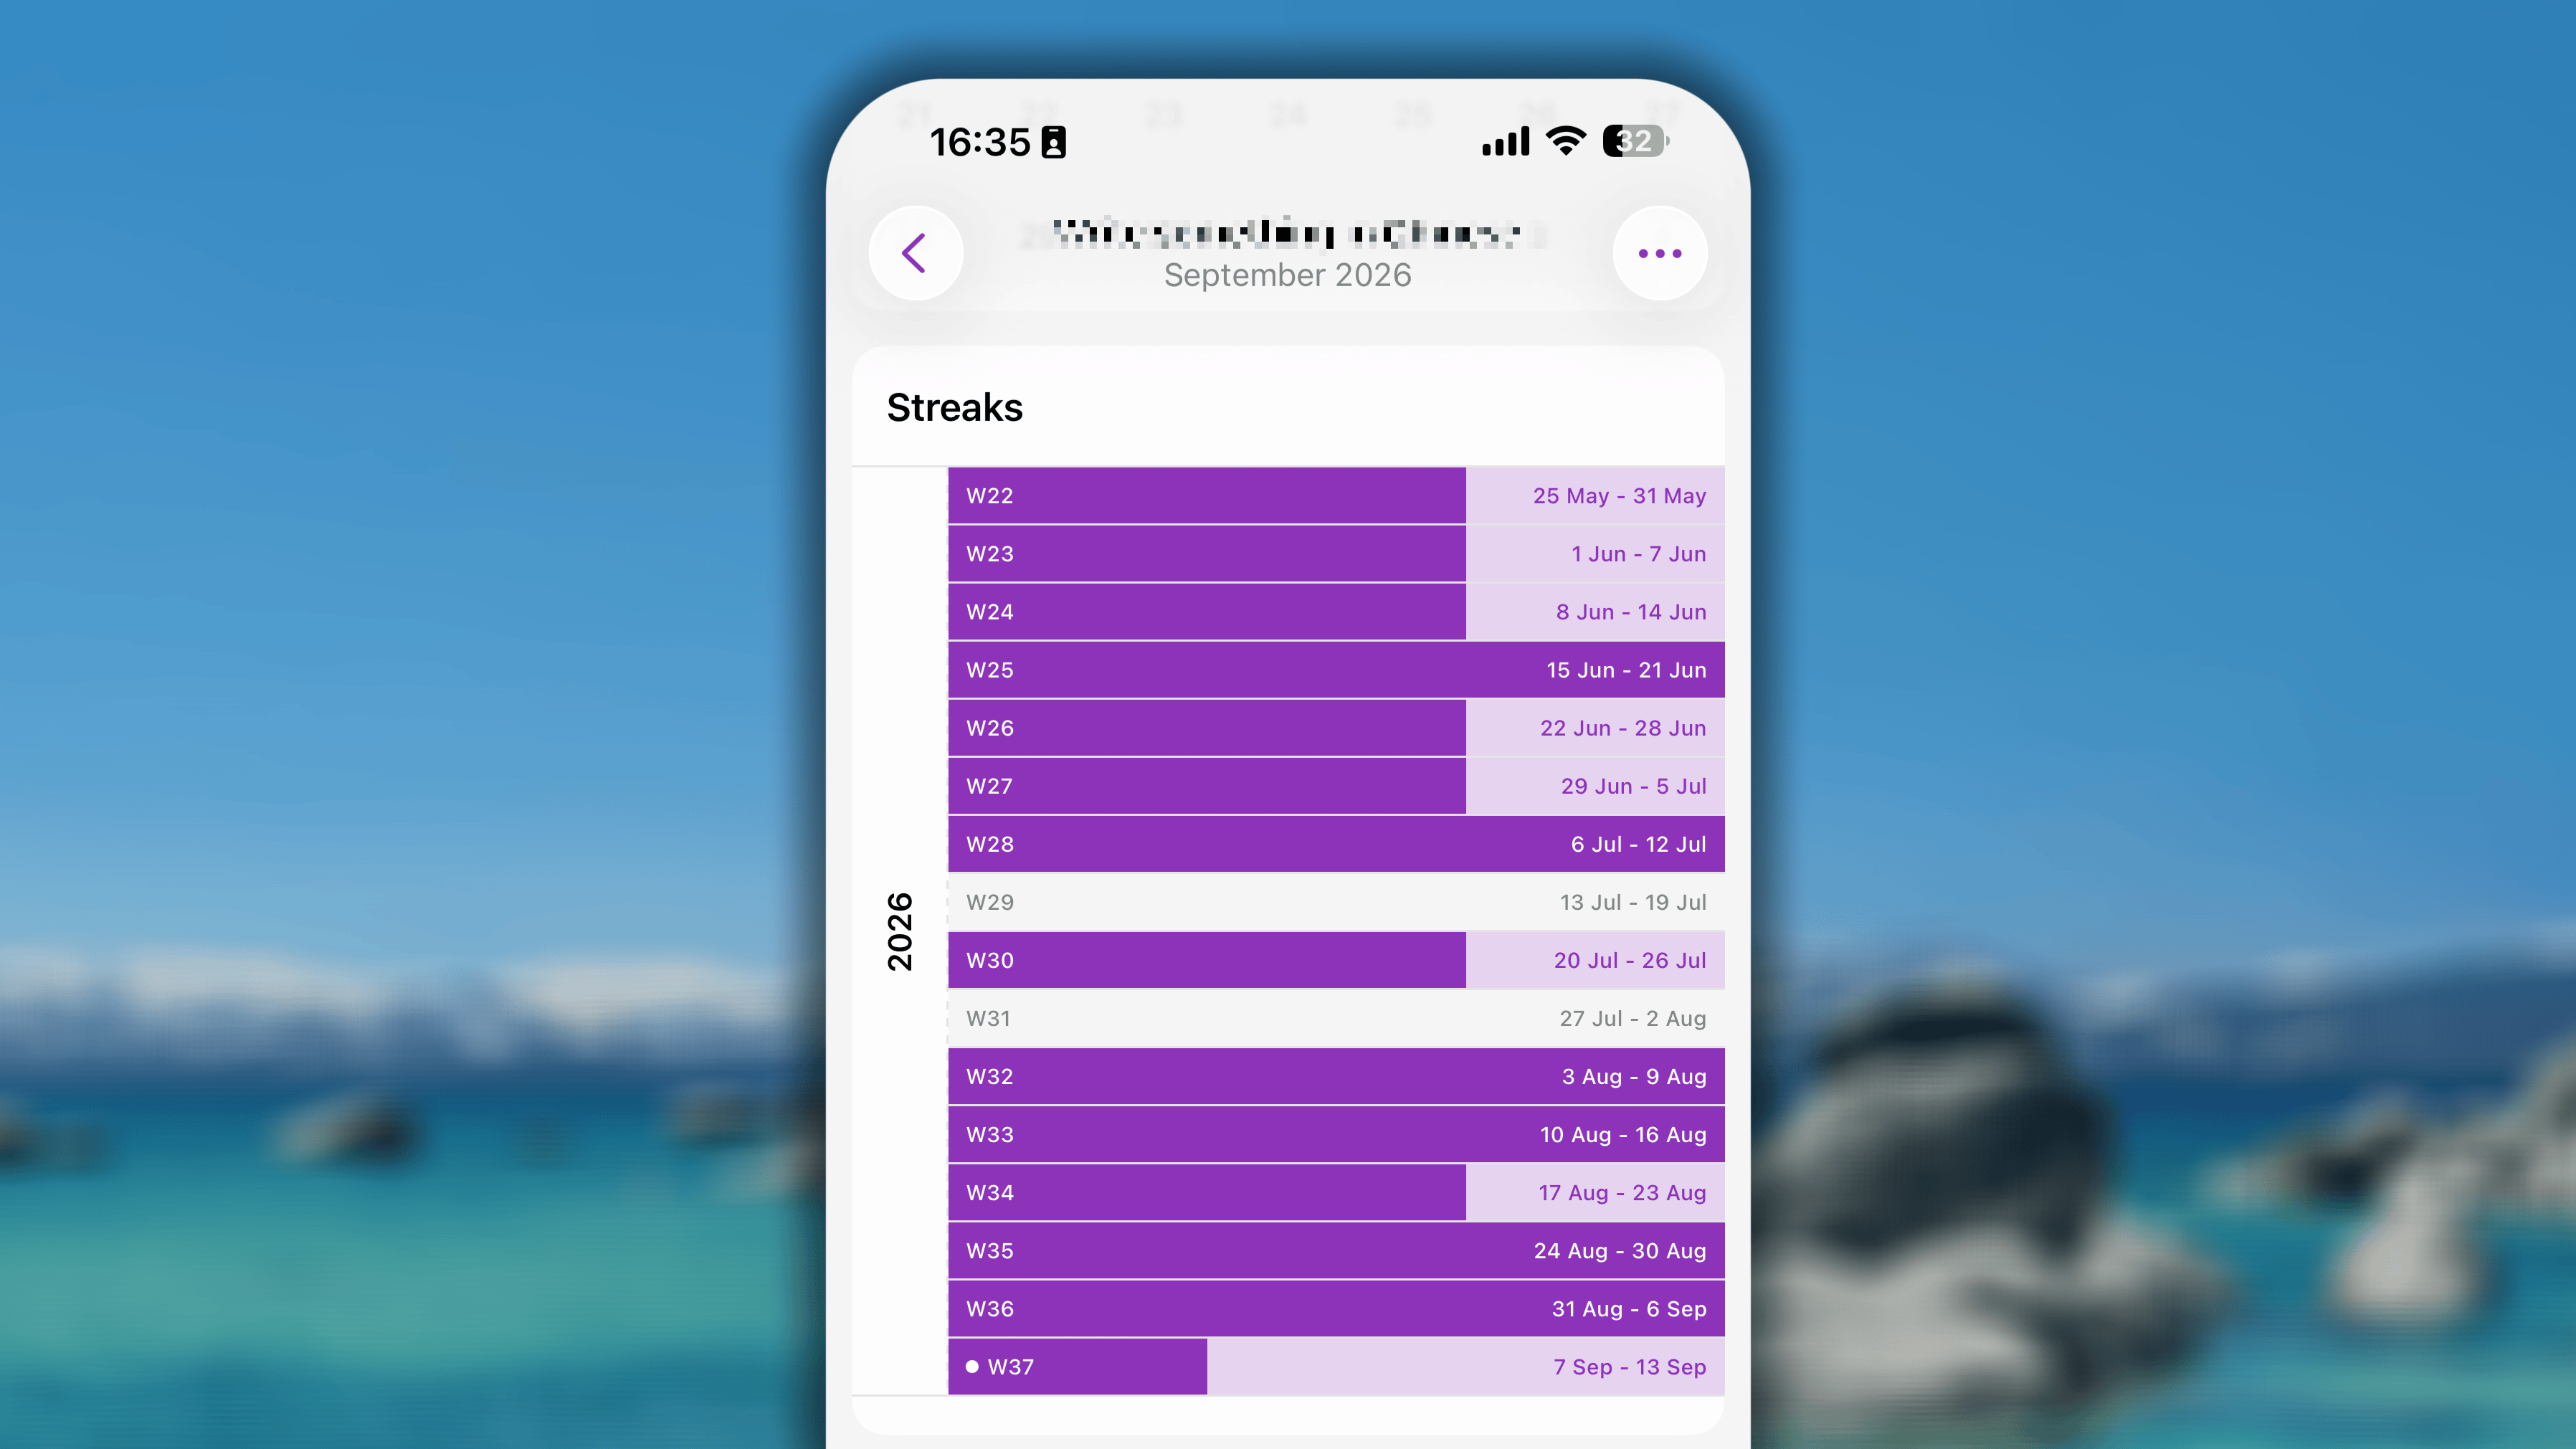
- For the habit with a per-week goal: your streak increases when you complete the weekly goal. Below your streak, you can see the progress of the last 7 weeks, or since your starting week.
- For the habit with a per-week goal: your streak increases when you complete the monthly goal. Below your streak, you can see the progress of the last 7 months, or since your starting month.
- For the habit with a per-year goal: your streak increases when you complete the annual goal. Below your streak, you can see the progress of the last 7 years, or since your starting year.
Progress Bar to End Condition
If your habit is set with an End Condition, a progress bar to track the journey until the ultimate goal will appear in this Single progress view of your habit.With this Progress Bar, you can see how long have you achieved and how long you have still to strive for until your big goal, closely and visually.Core indexes

- Success: displays the number of days you achieved your habit goal in the month.
- Failed: shows the number of days you marked as failed for the habit in the month.
- Skipped: indicates the number of days you marked as skipped for the habit in the month.
- Total: reflects the total amount or number of times you have completed the habit, with the unit aligned to your goal’s unit (e.g., minutes) in the month.
How “Success” is calculated?
- If your habit is a daily habit, it will be the number of days you complete your goal.
- If your habit is a habit with per-week goal, once you complete the goal of a week, it will be counted as 7 days of success, excluding the number of days you mark as Skip or Fail.
- If your habit a habit with per-month goal, once you complete this month’s goal, it will be the total days of the month, excluding the number of days you mark as Skip or Fail.
- If your habit is a habit with per-year goal, once you complete this month’s goal, it will be the total days of the year, excluding the number of days you mark as Skip or Fail.
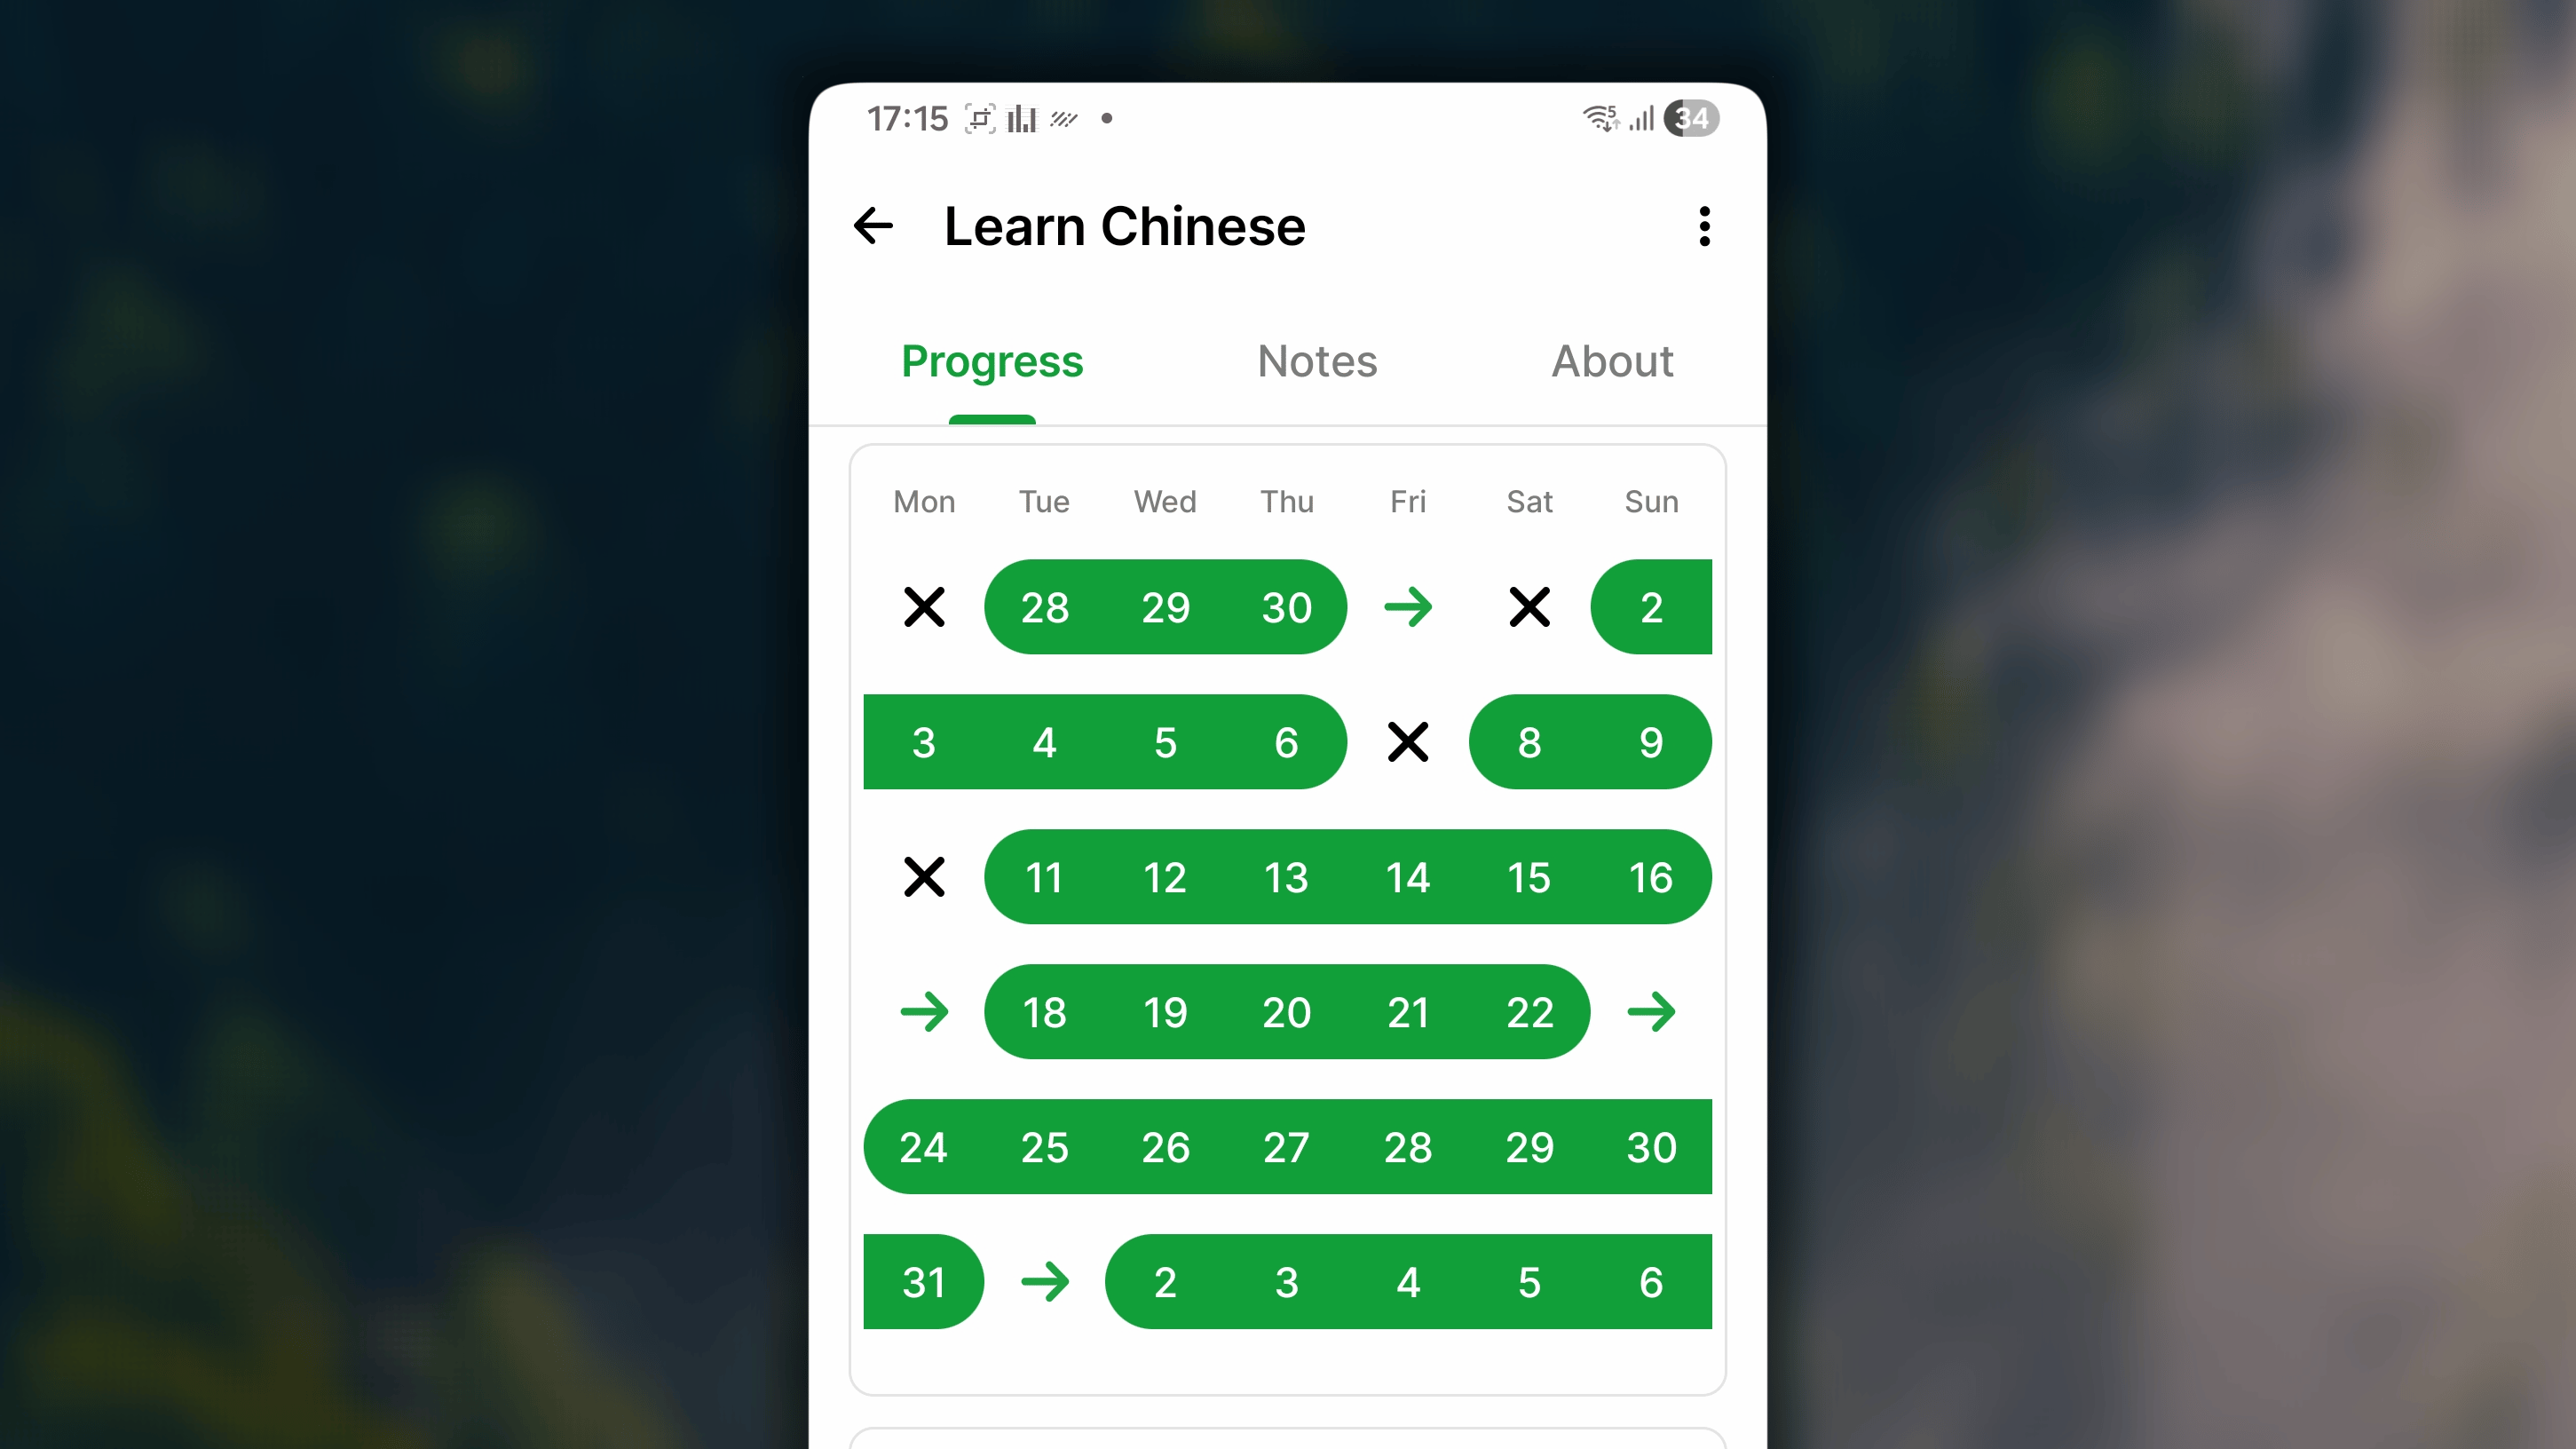
Progress in Calendar
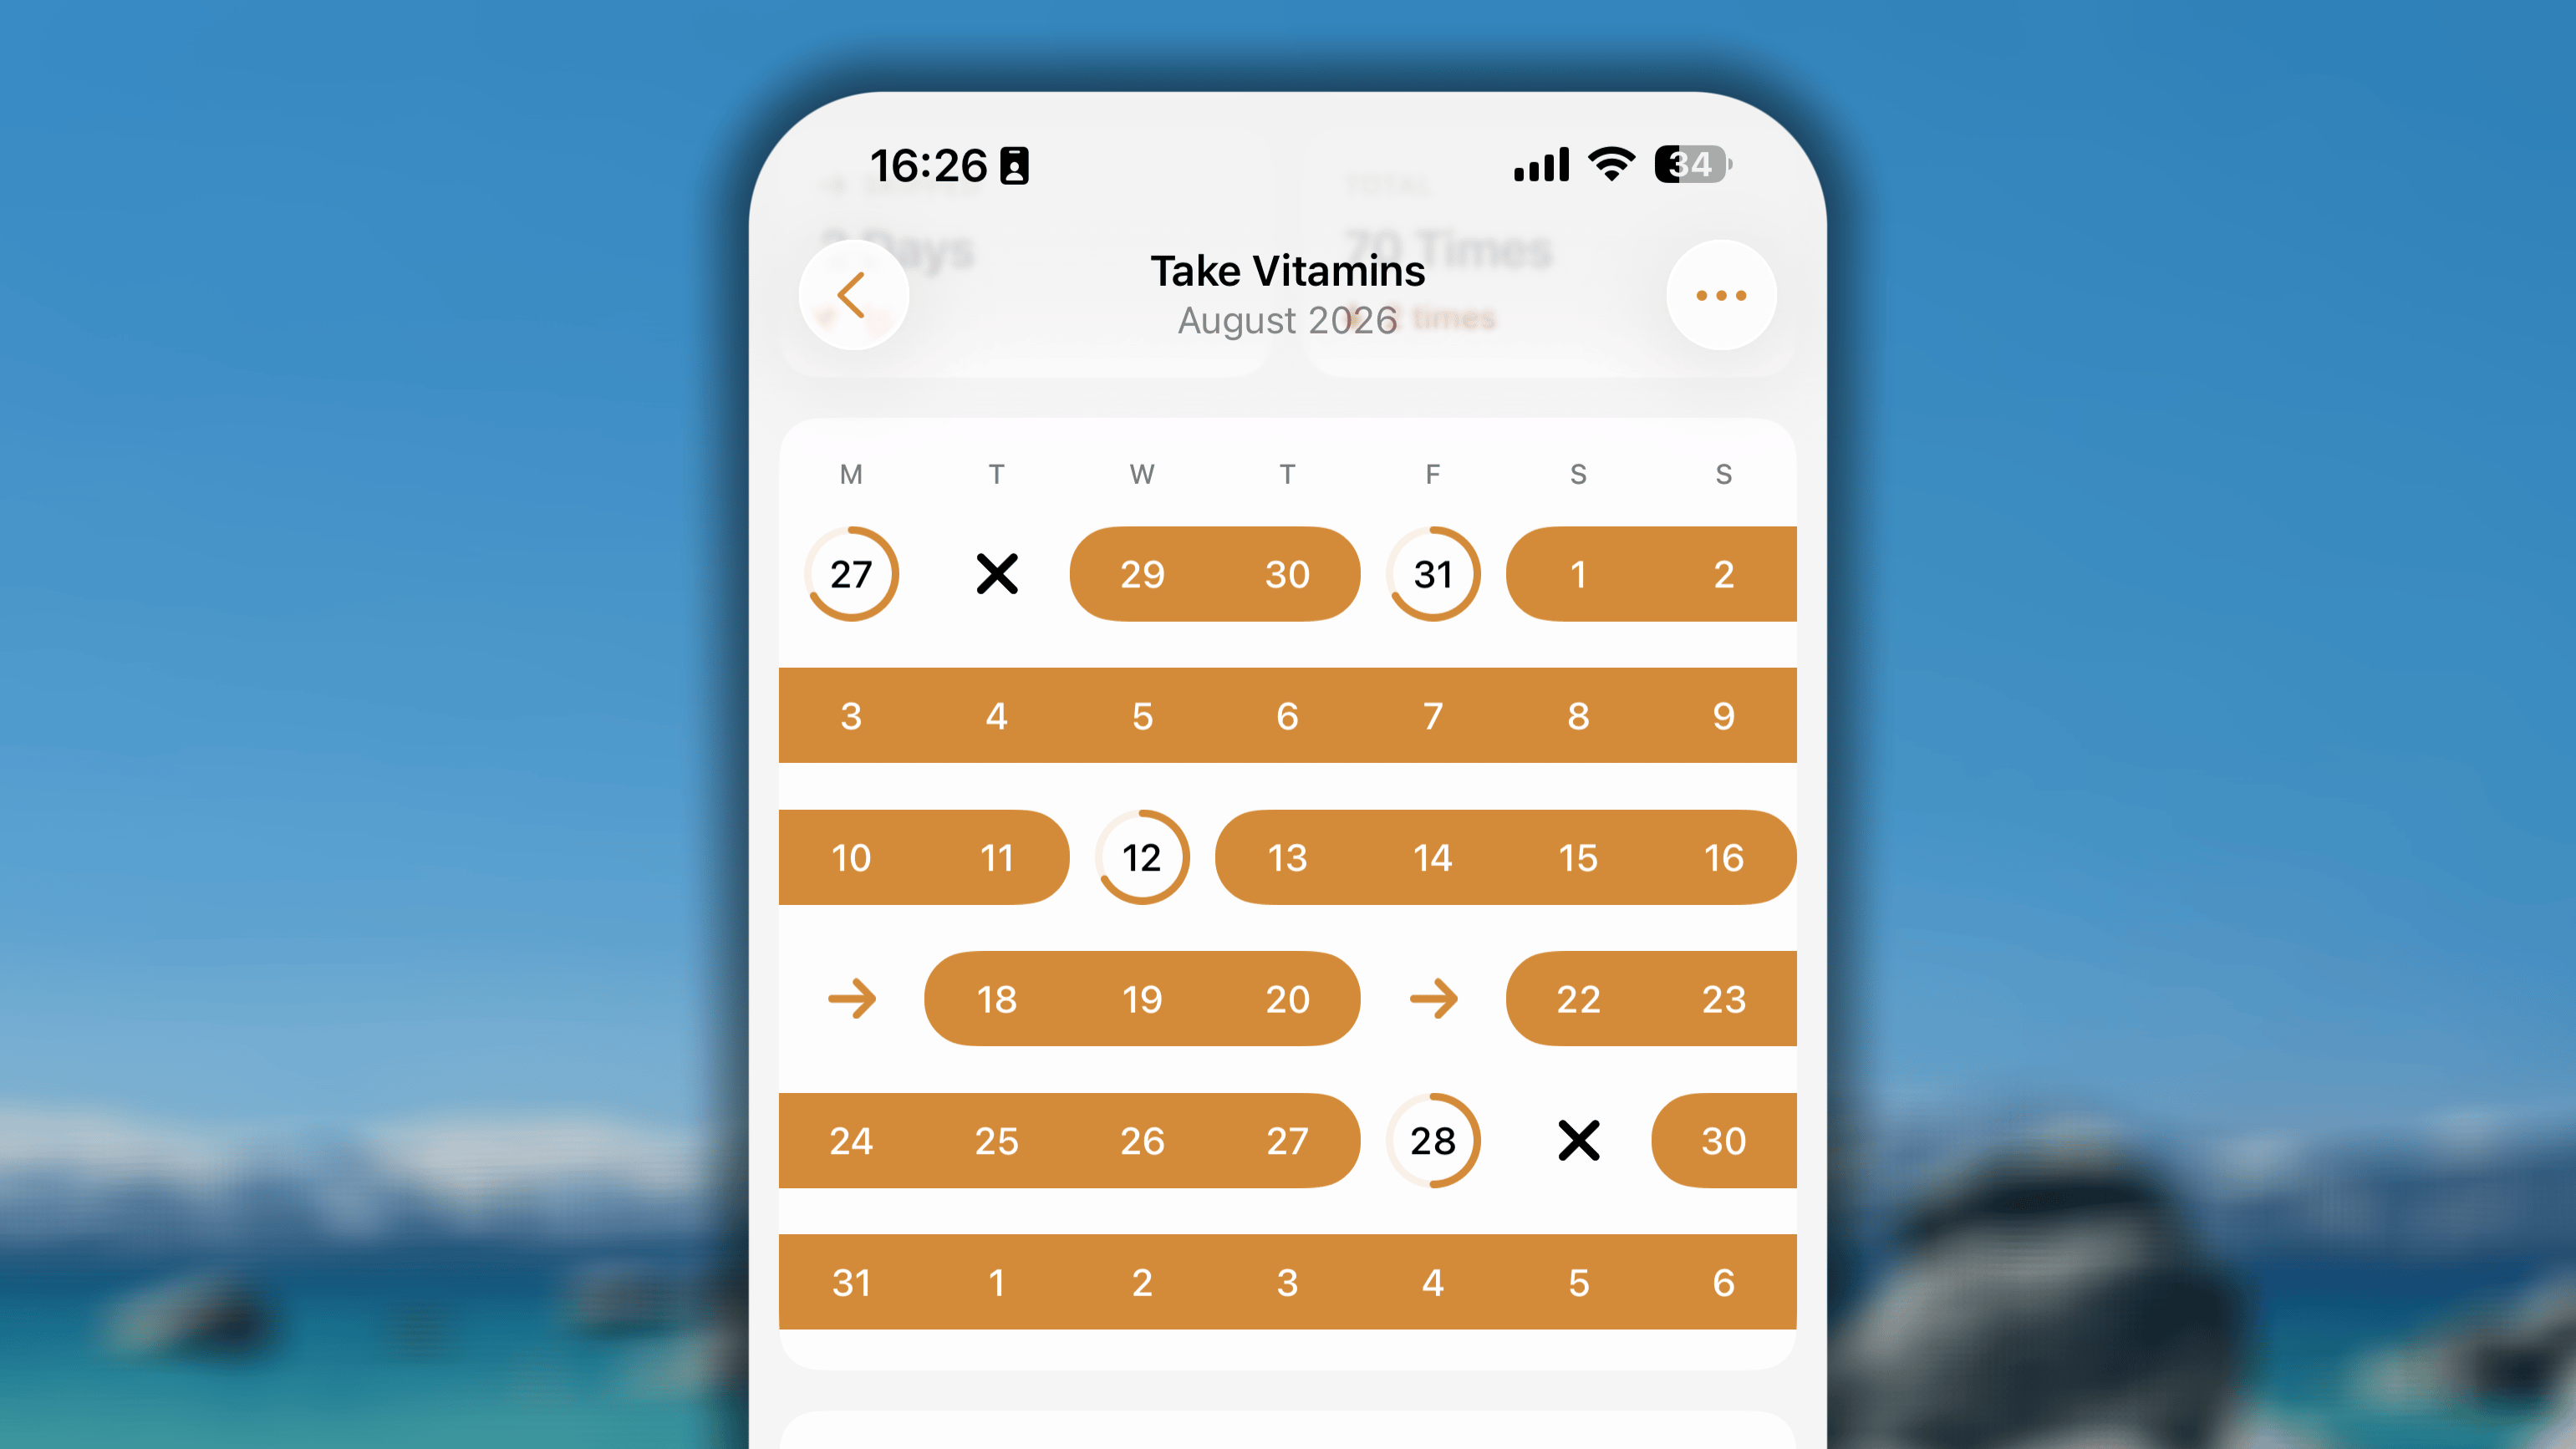
- A solid colored circle: the day you mark your habit as Completed, or have any progress on habits with per-week, per-month, or per-year goal.
- An incomplete circle: the day you do some progress on your habit with a per-day goal.
- An right-headed arrow: the day you mark your habit as Skipped.
- A black cross: the day you mark your habit as Failed.
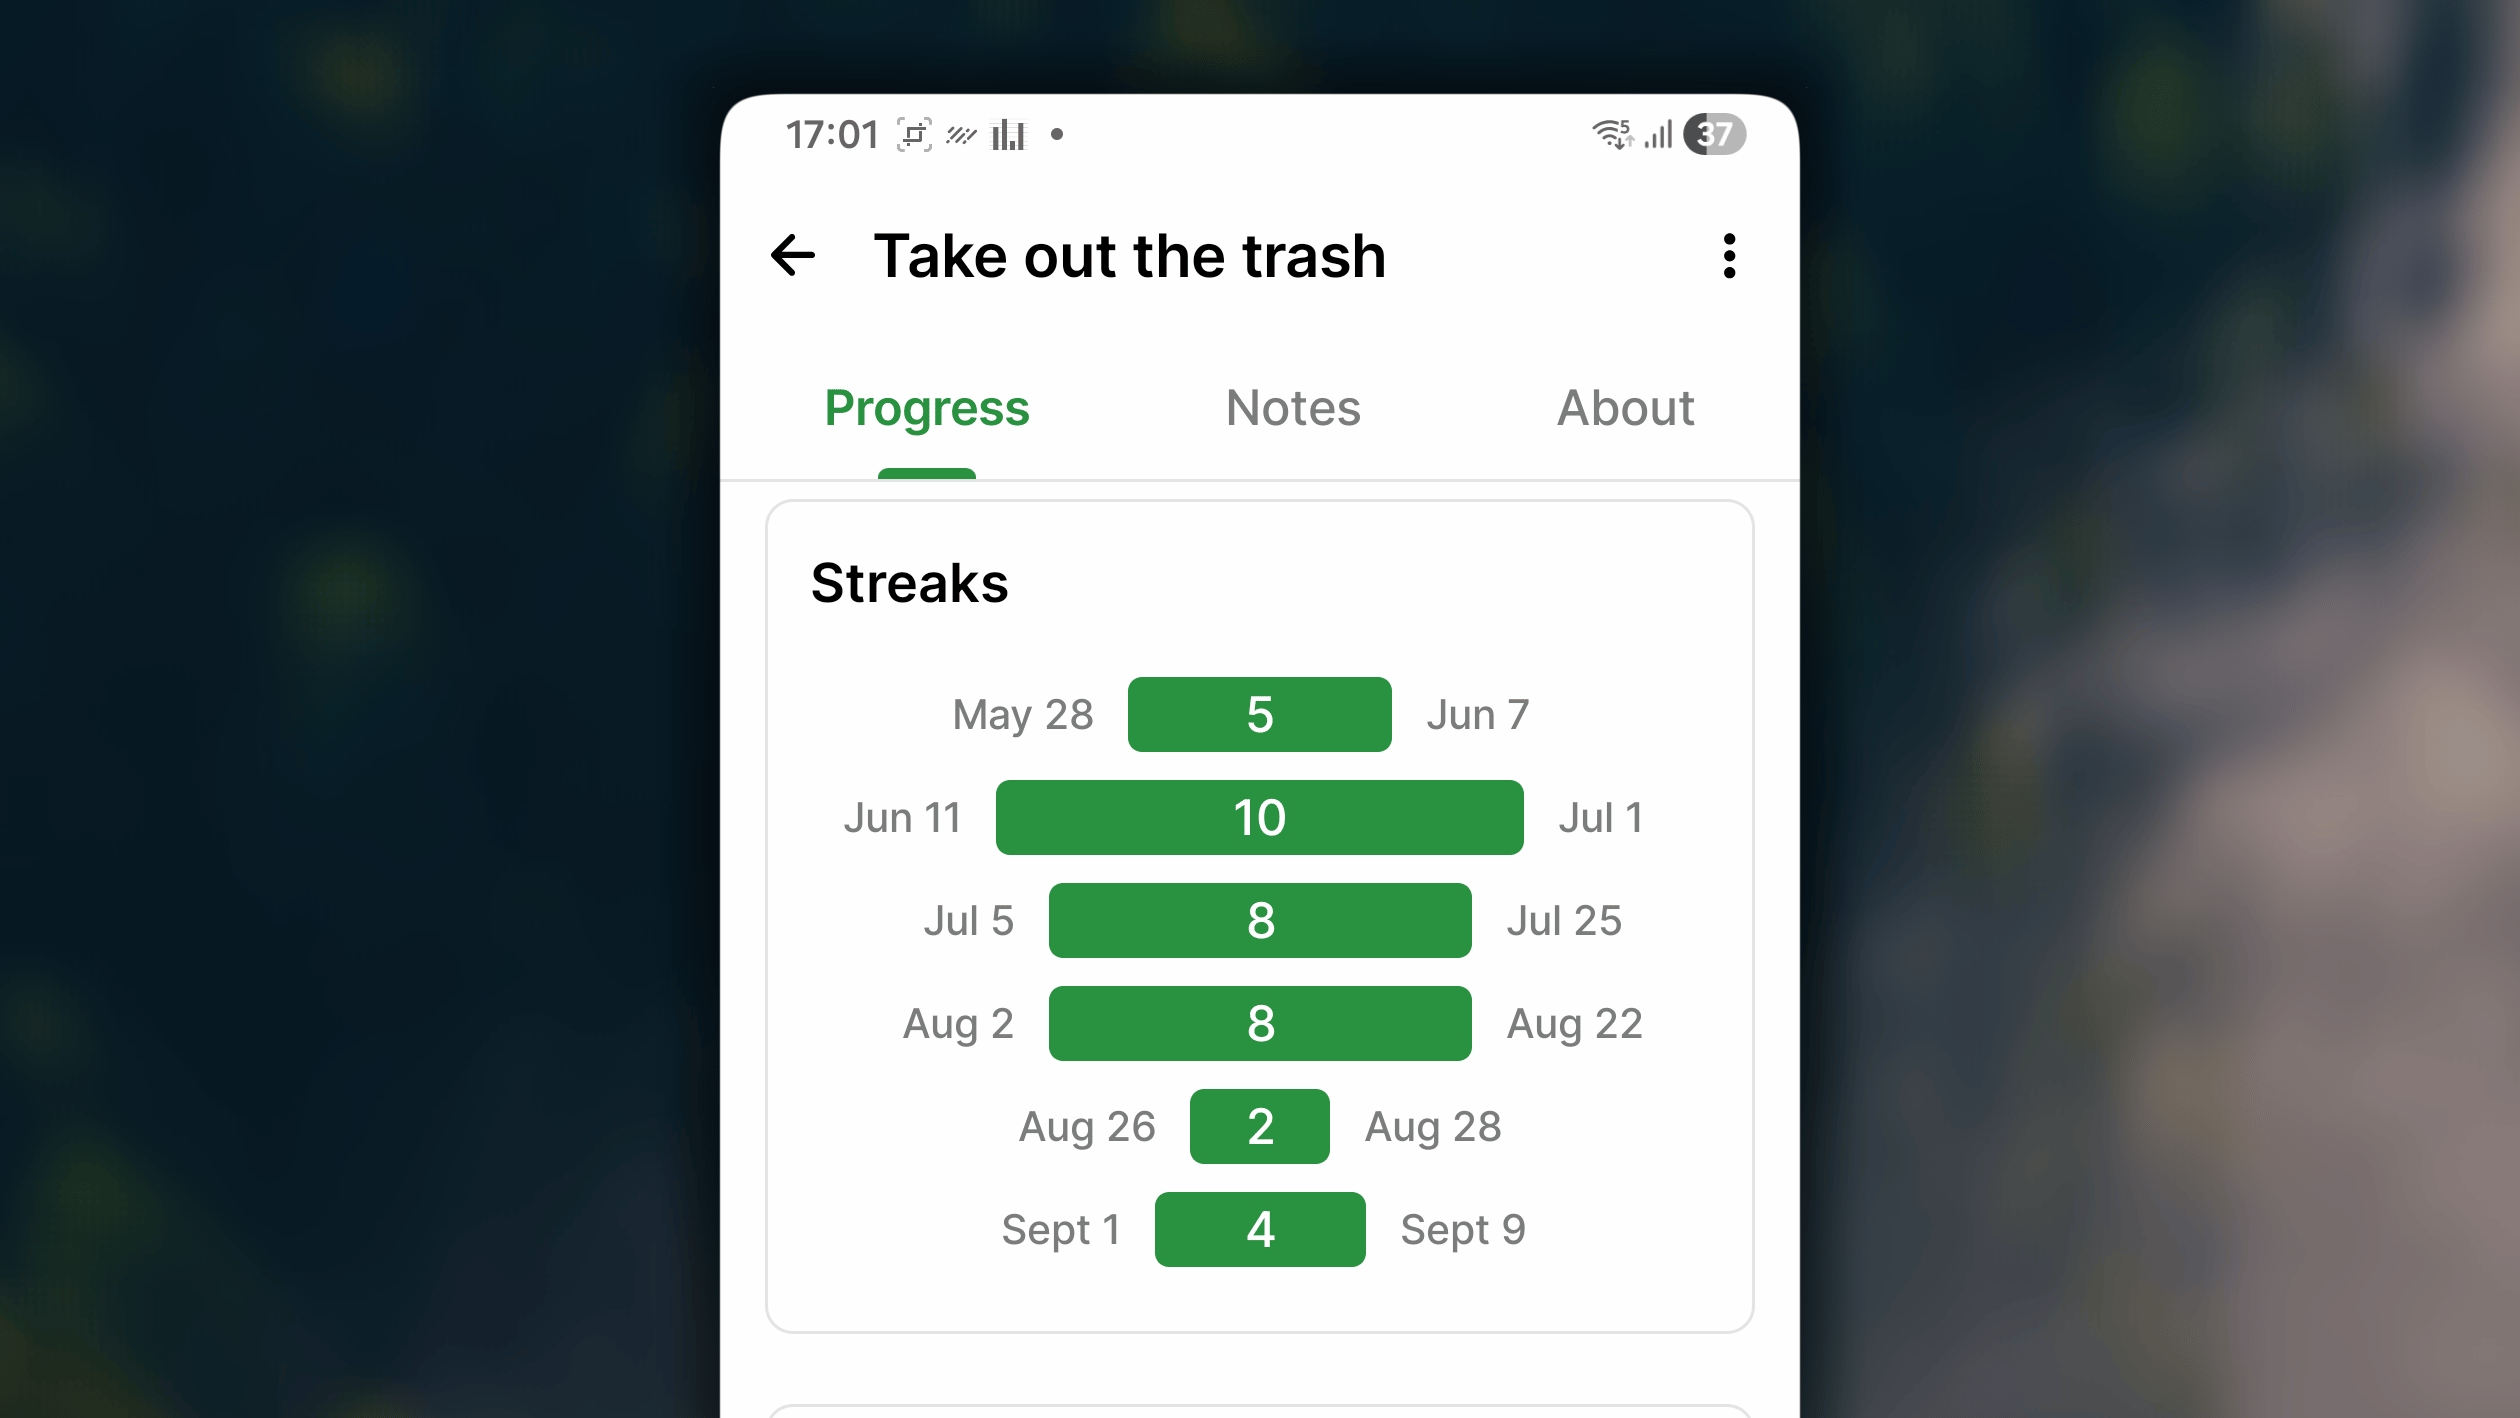
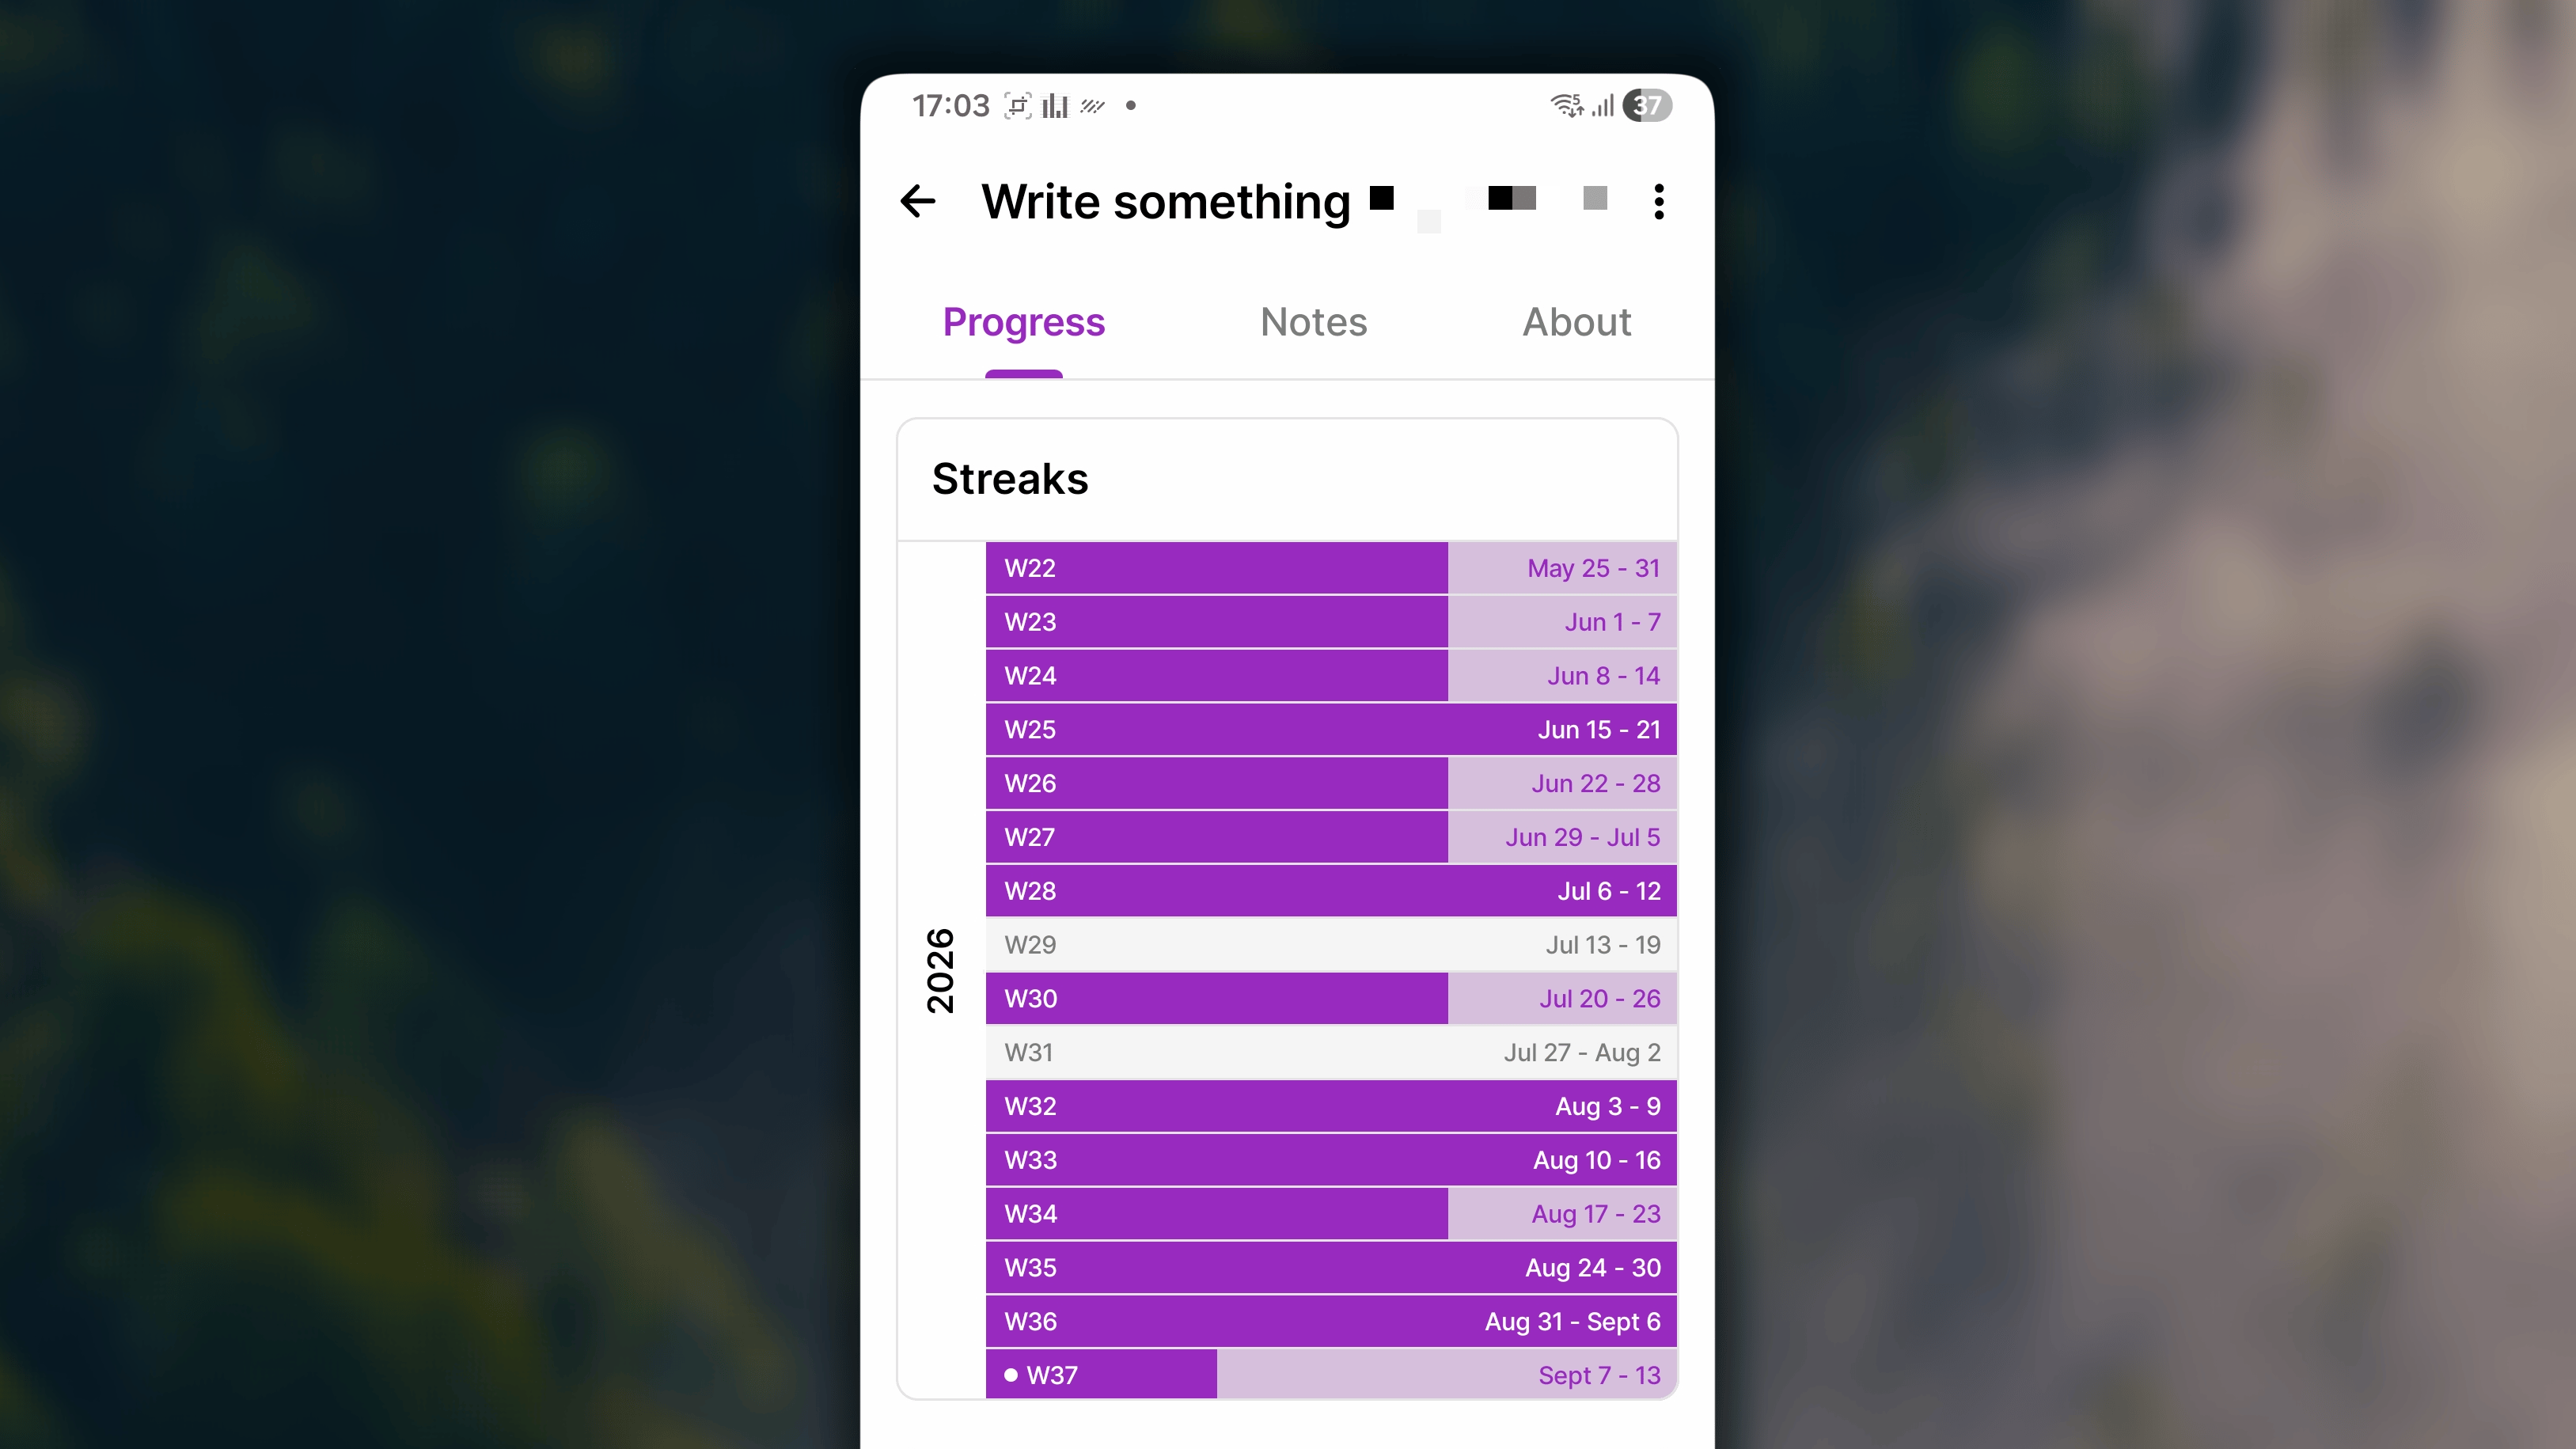
Streak History
If your habit has a per-day goal, this section will show you the streaks that you have achieved with your habit, from the first one you got to the most recent one.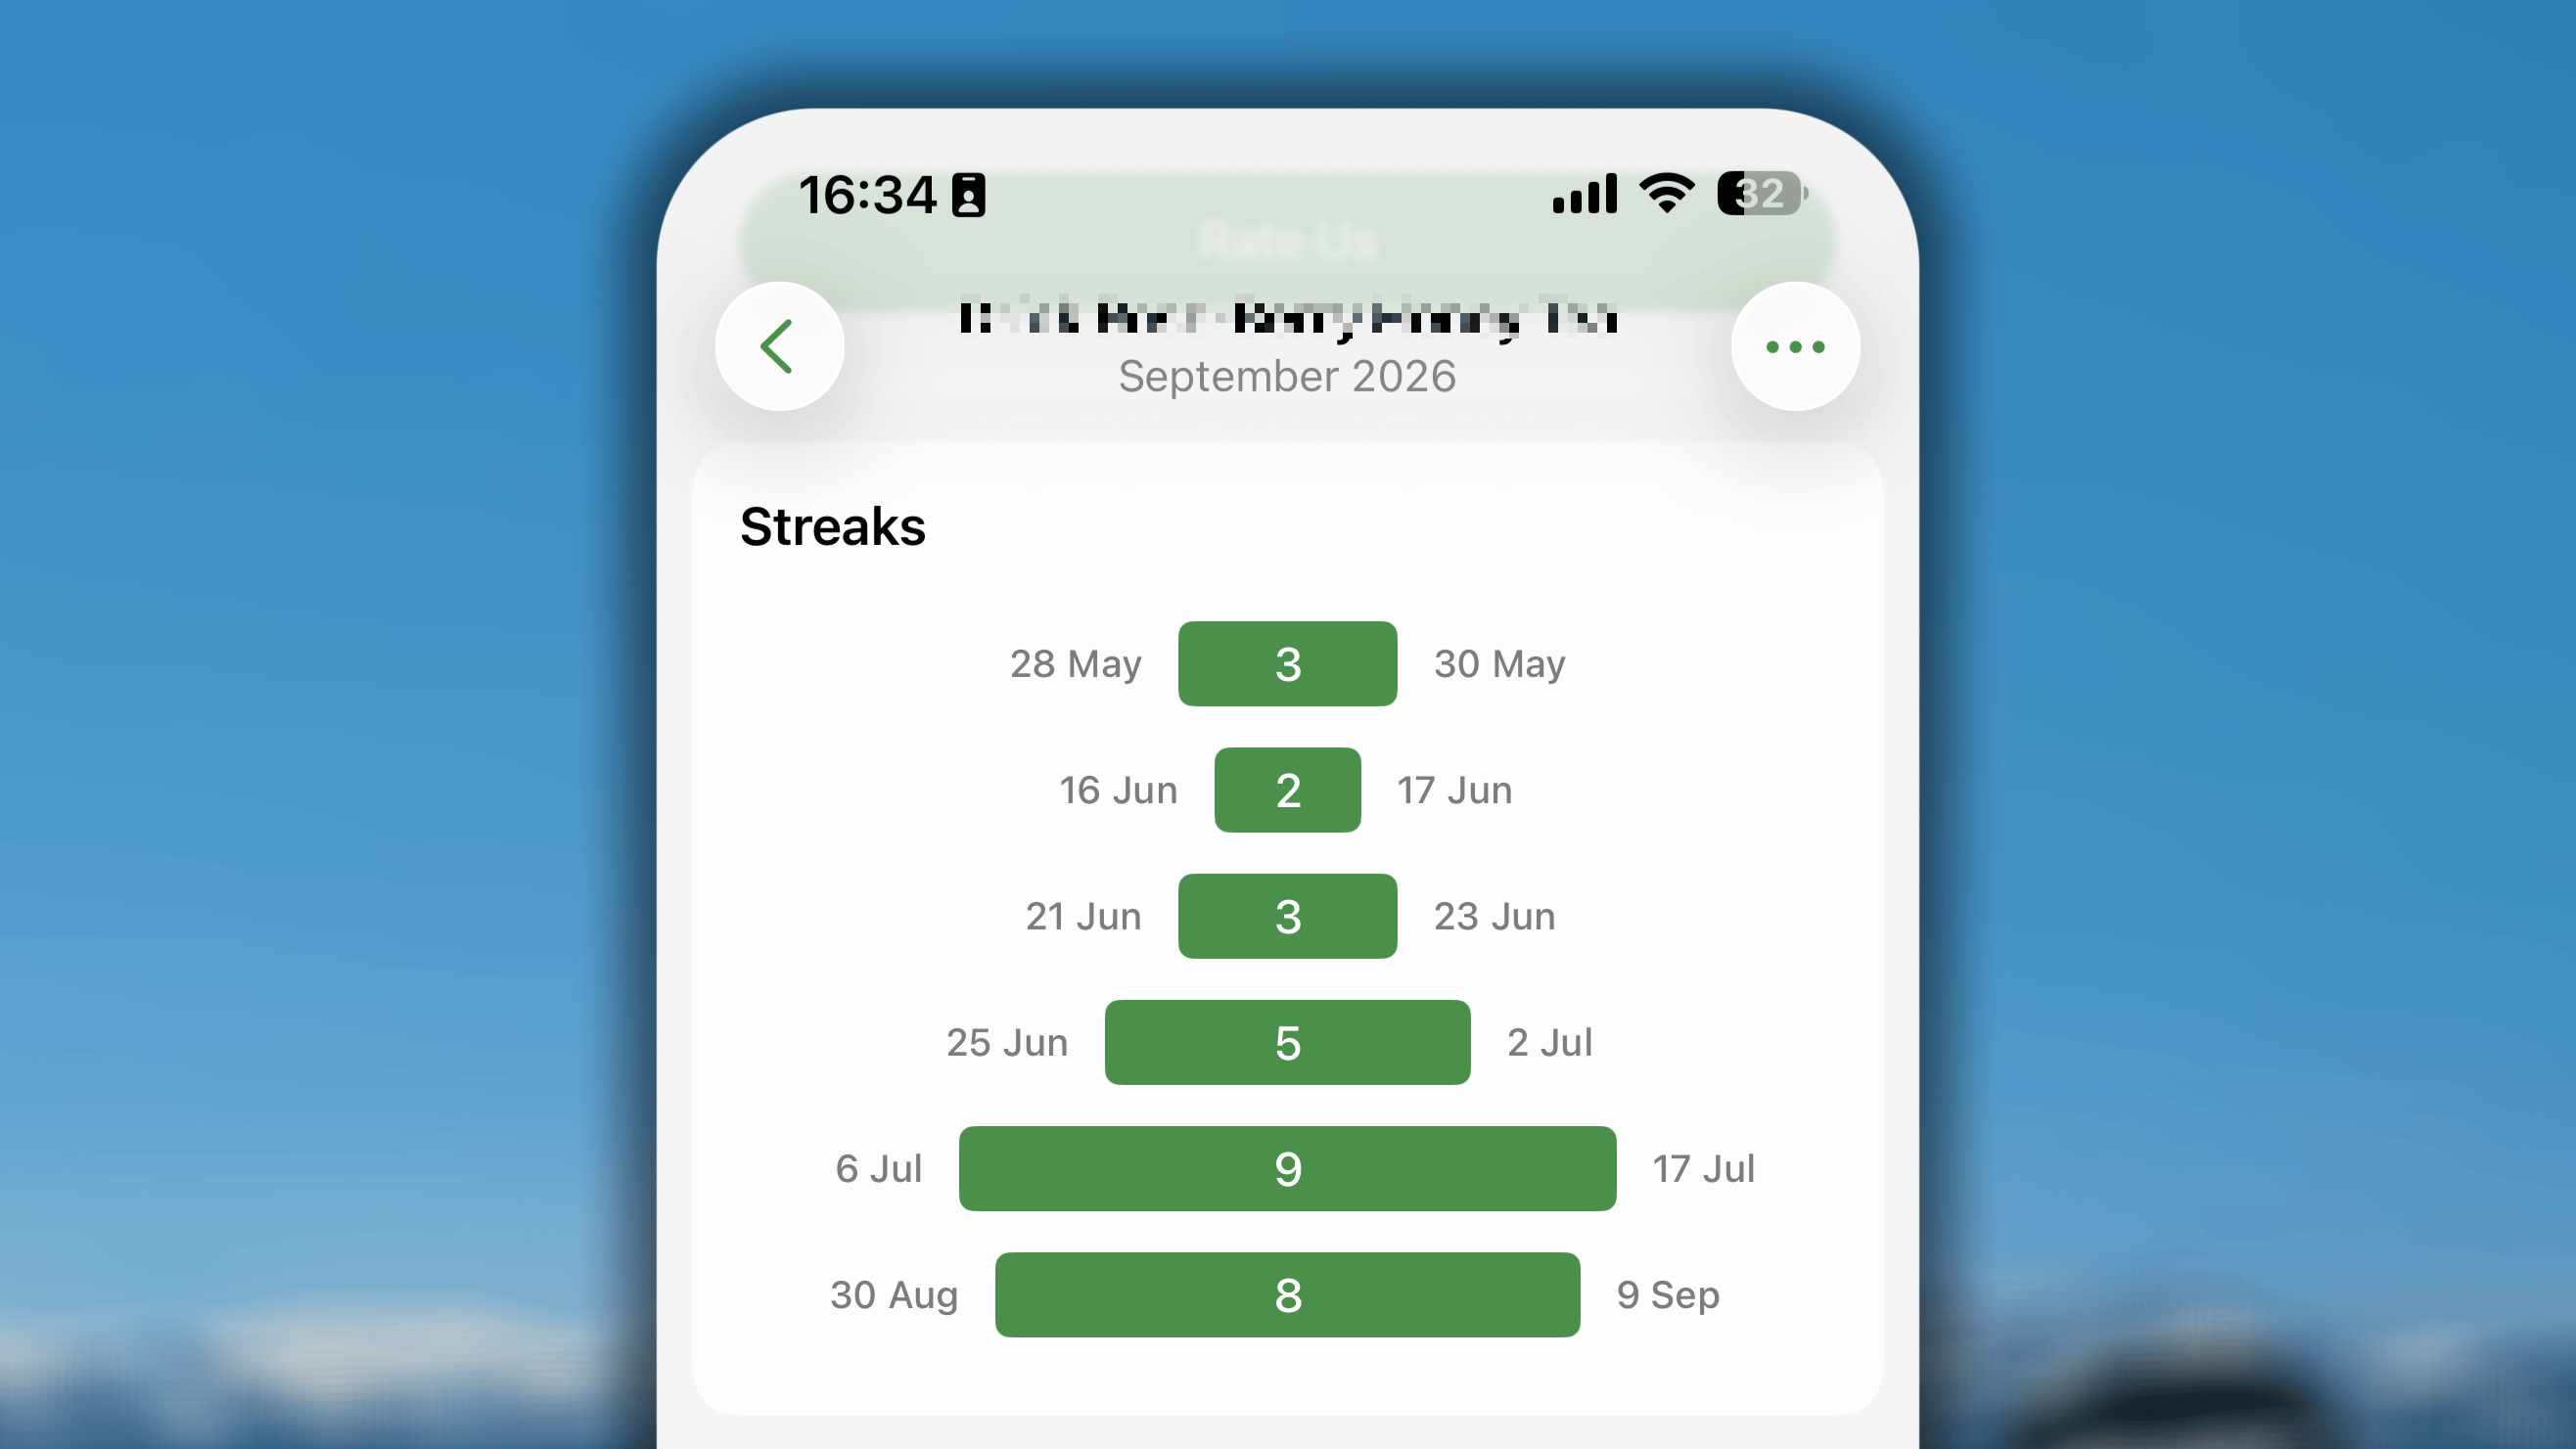
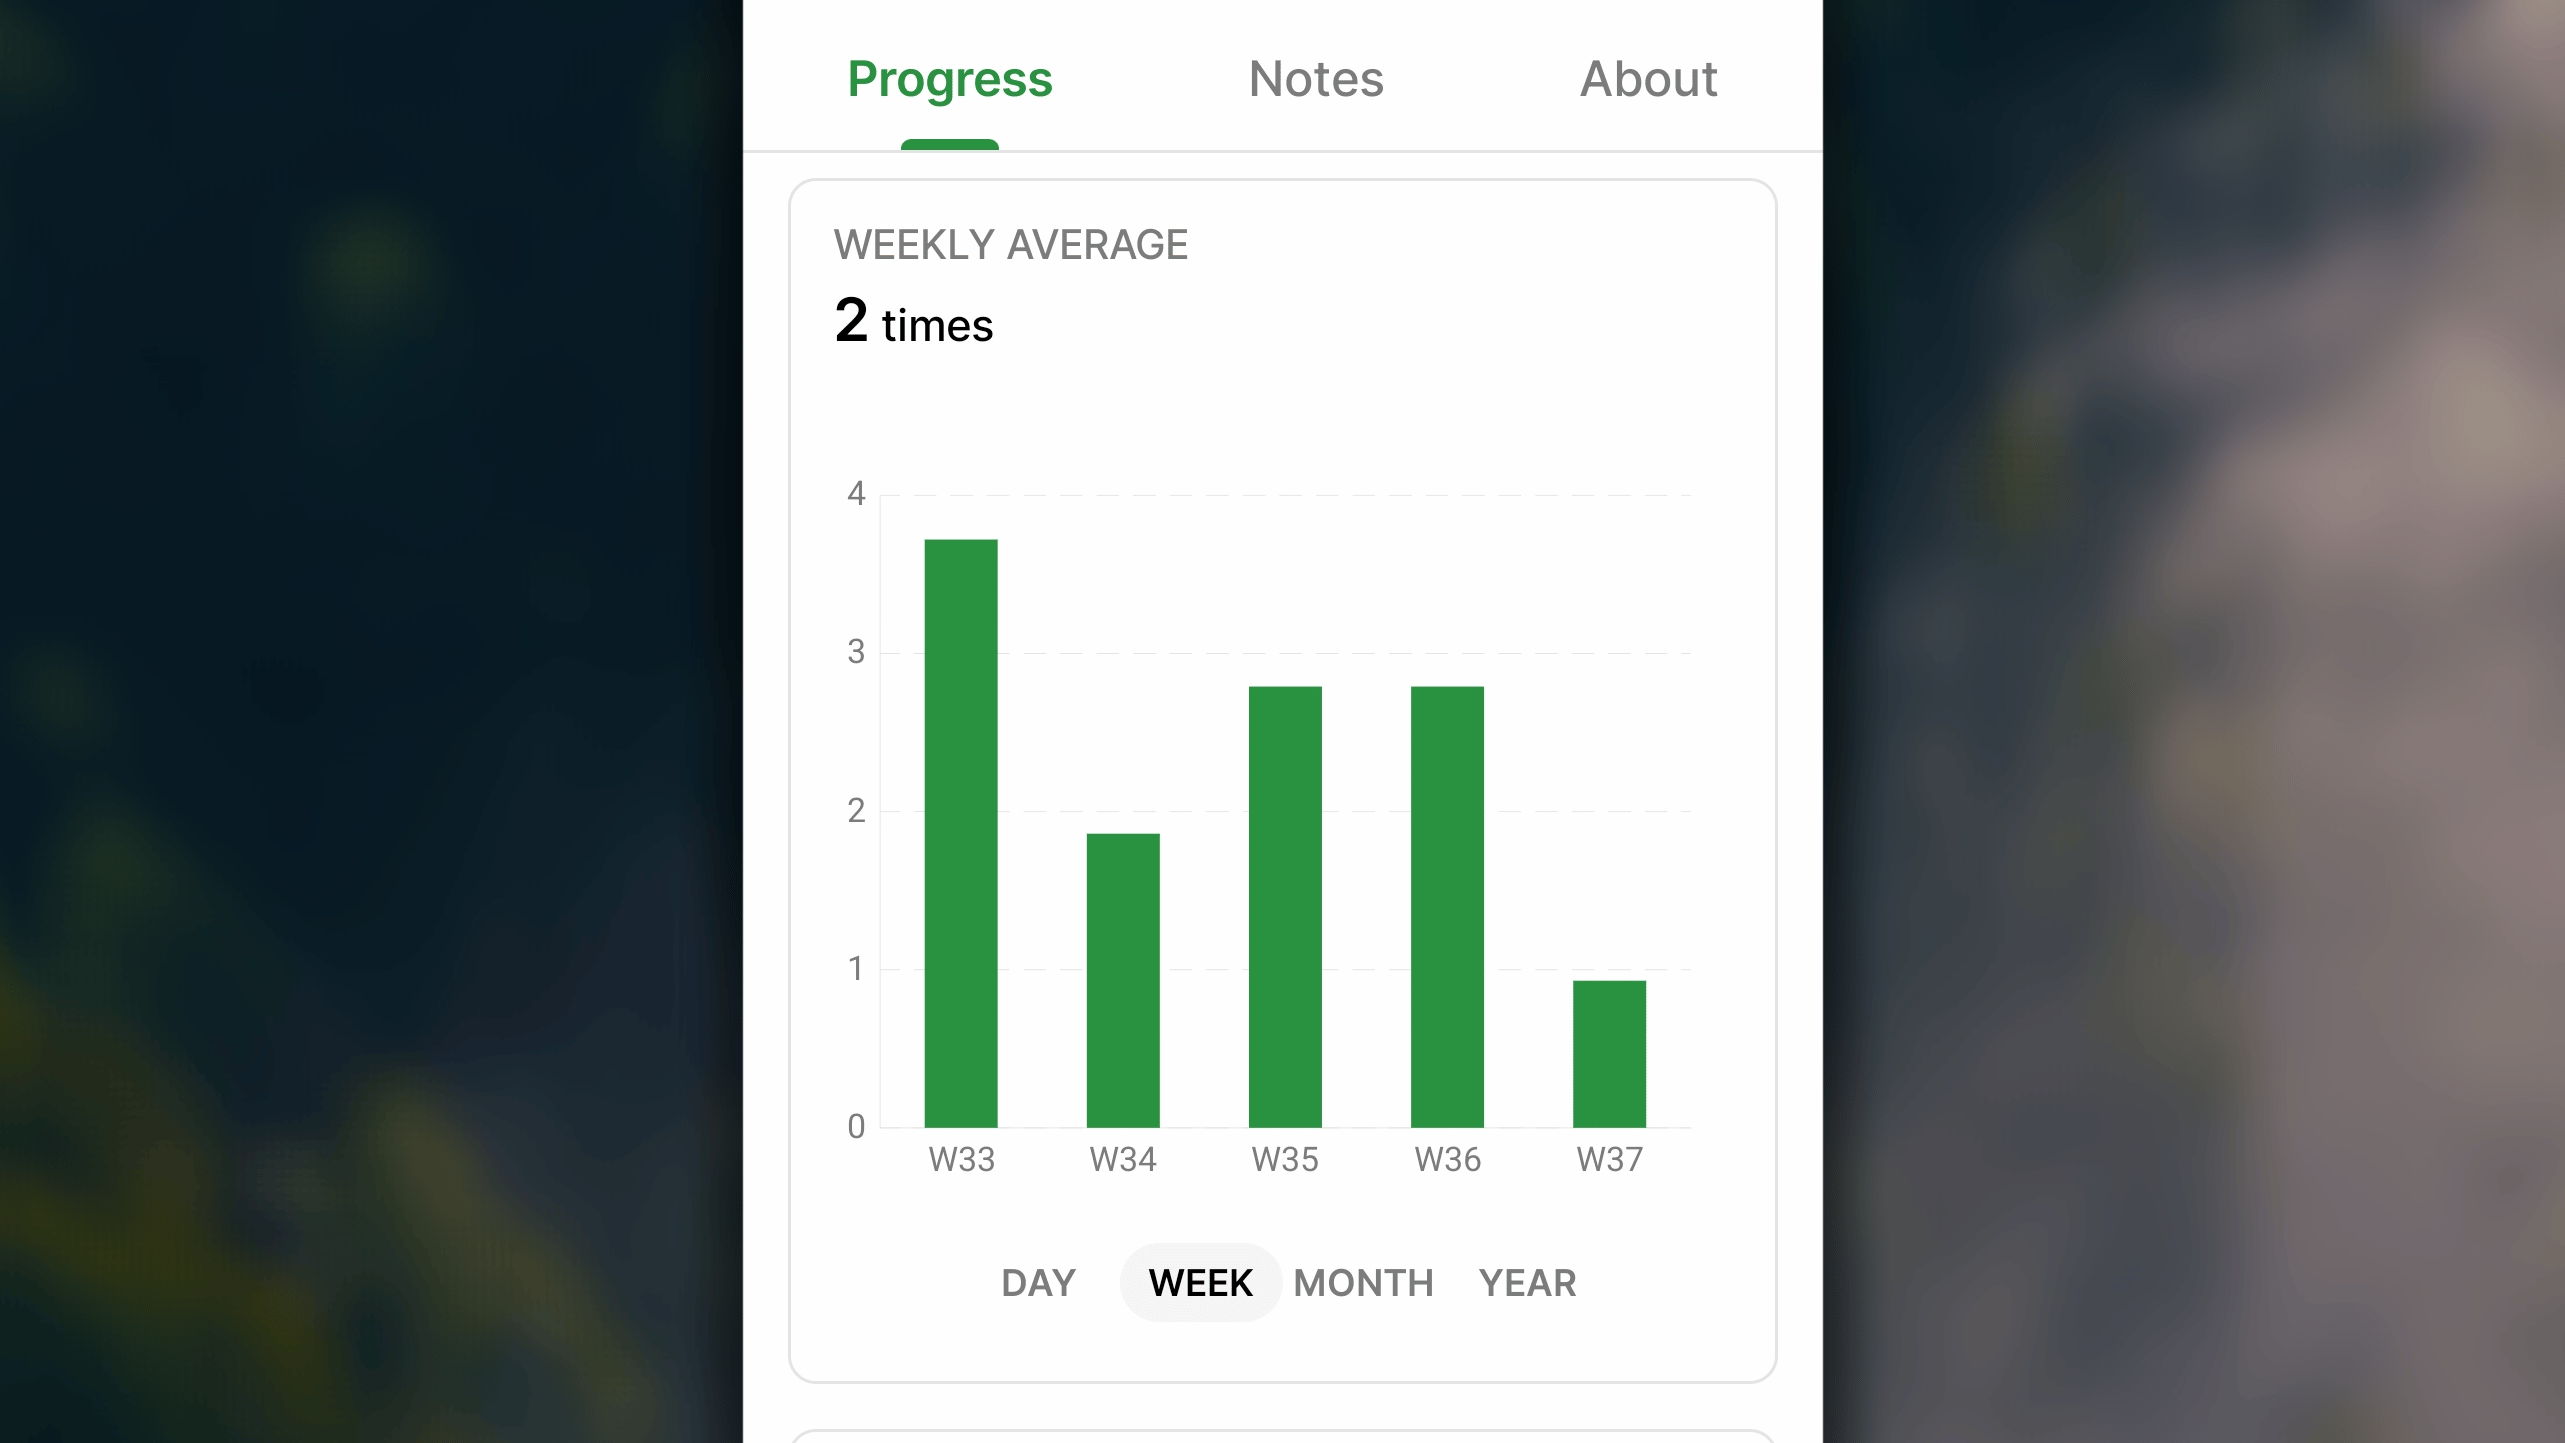
Trending column chart
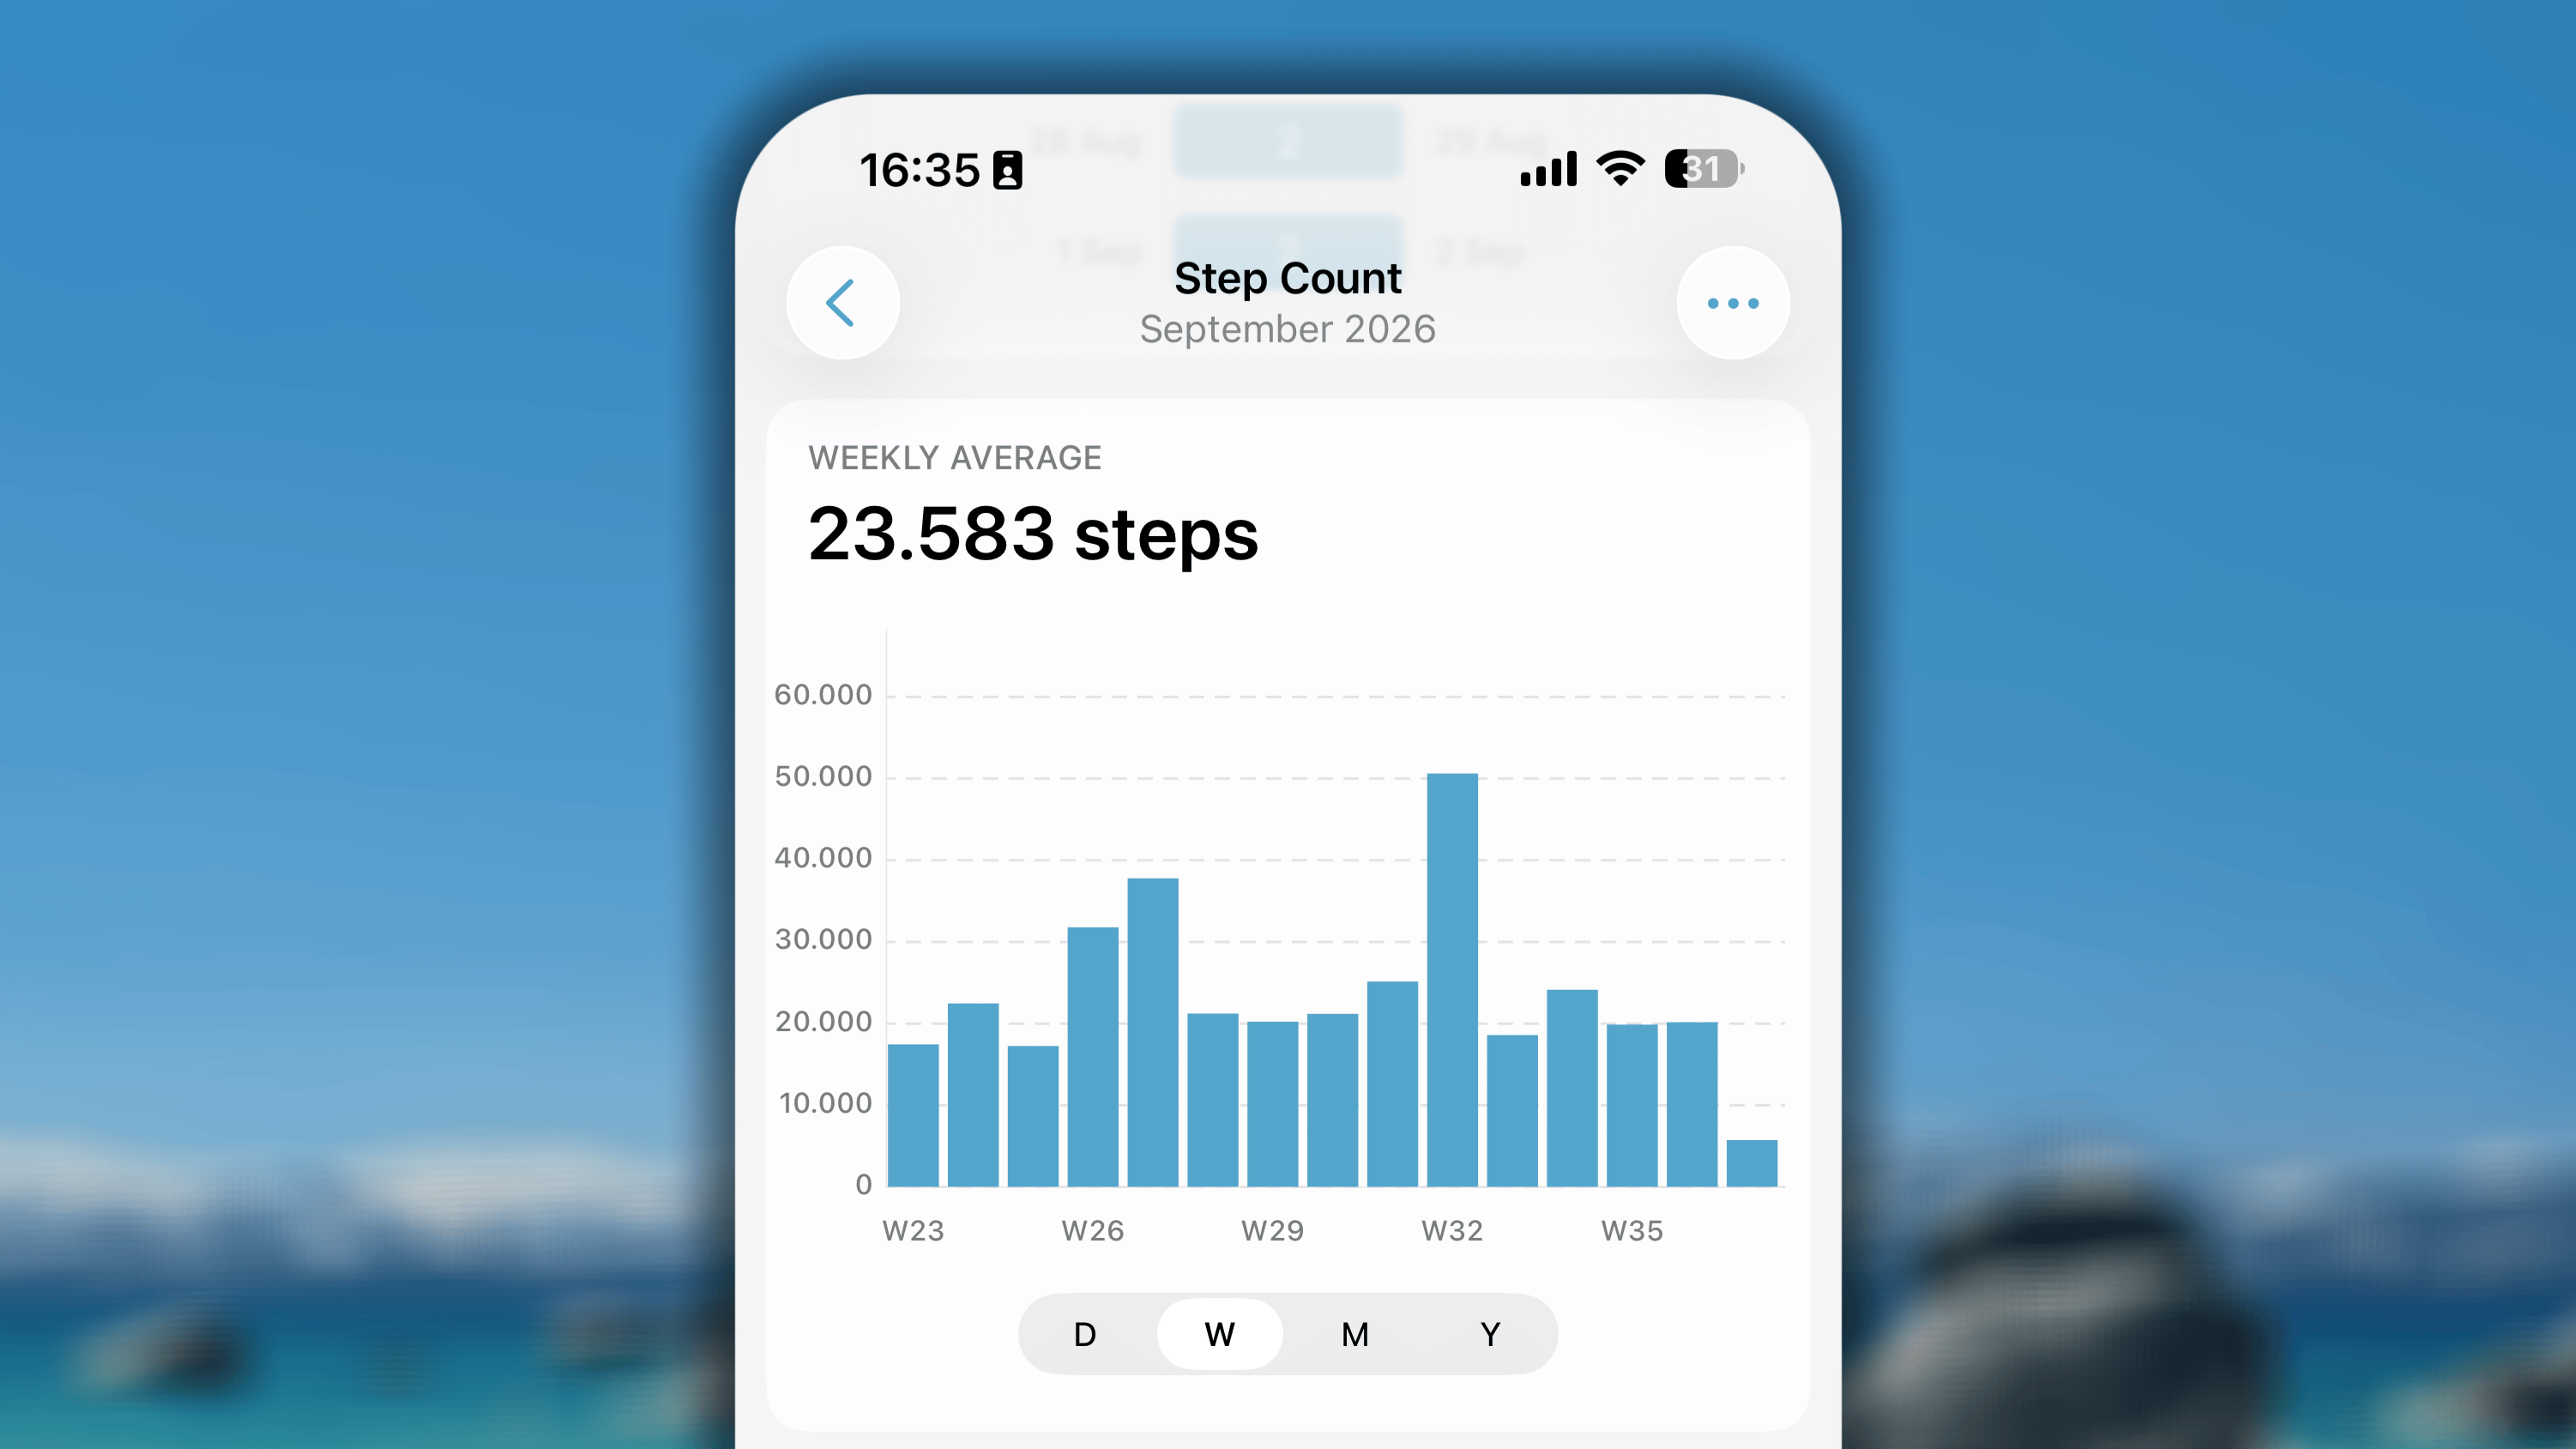
- Your performance trend: Each column shows your total achievement for that period (for example, each day of the week or each month of the year).
- Exact details: Tap and hold any column to see the specific number you achieved for that single period.
- Your average: The chart also calculates your average achievement per period since you started the habit.
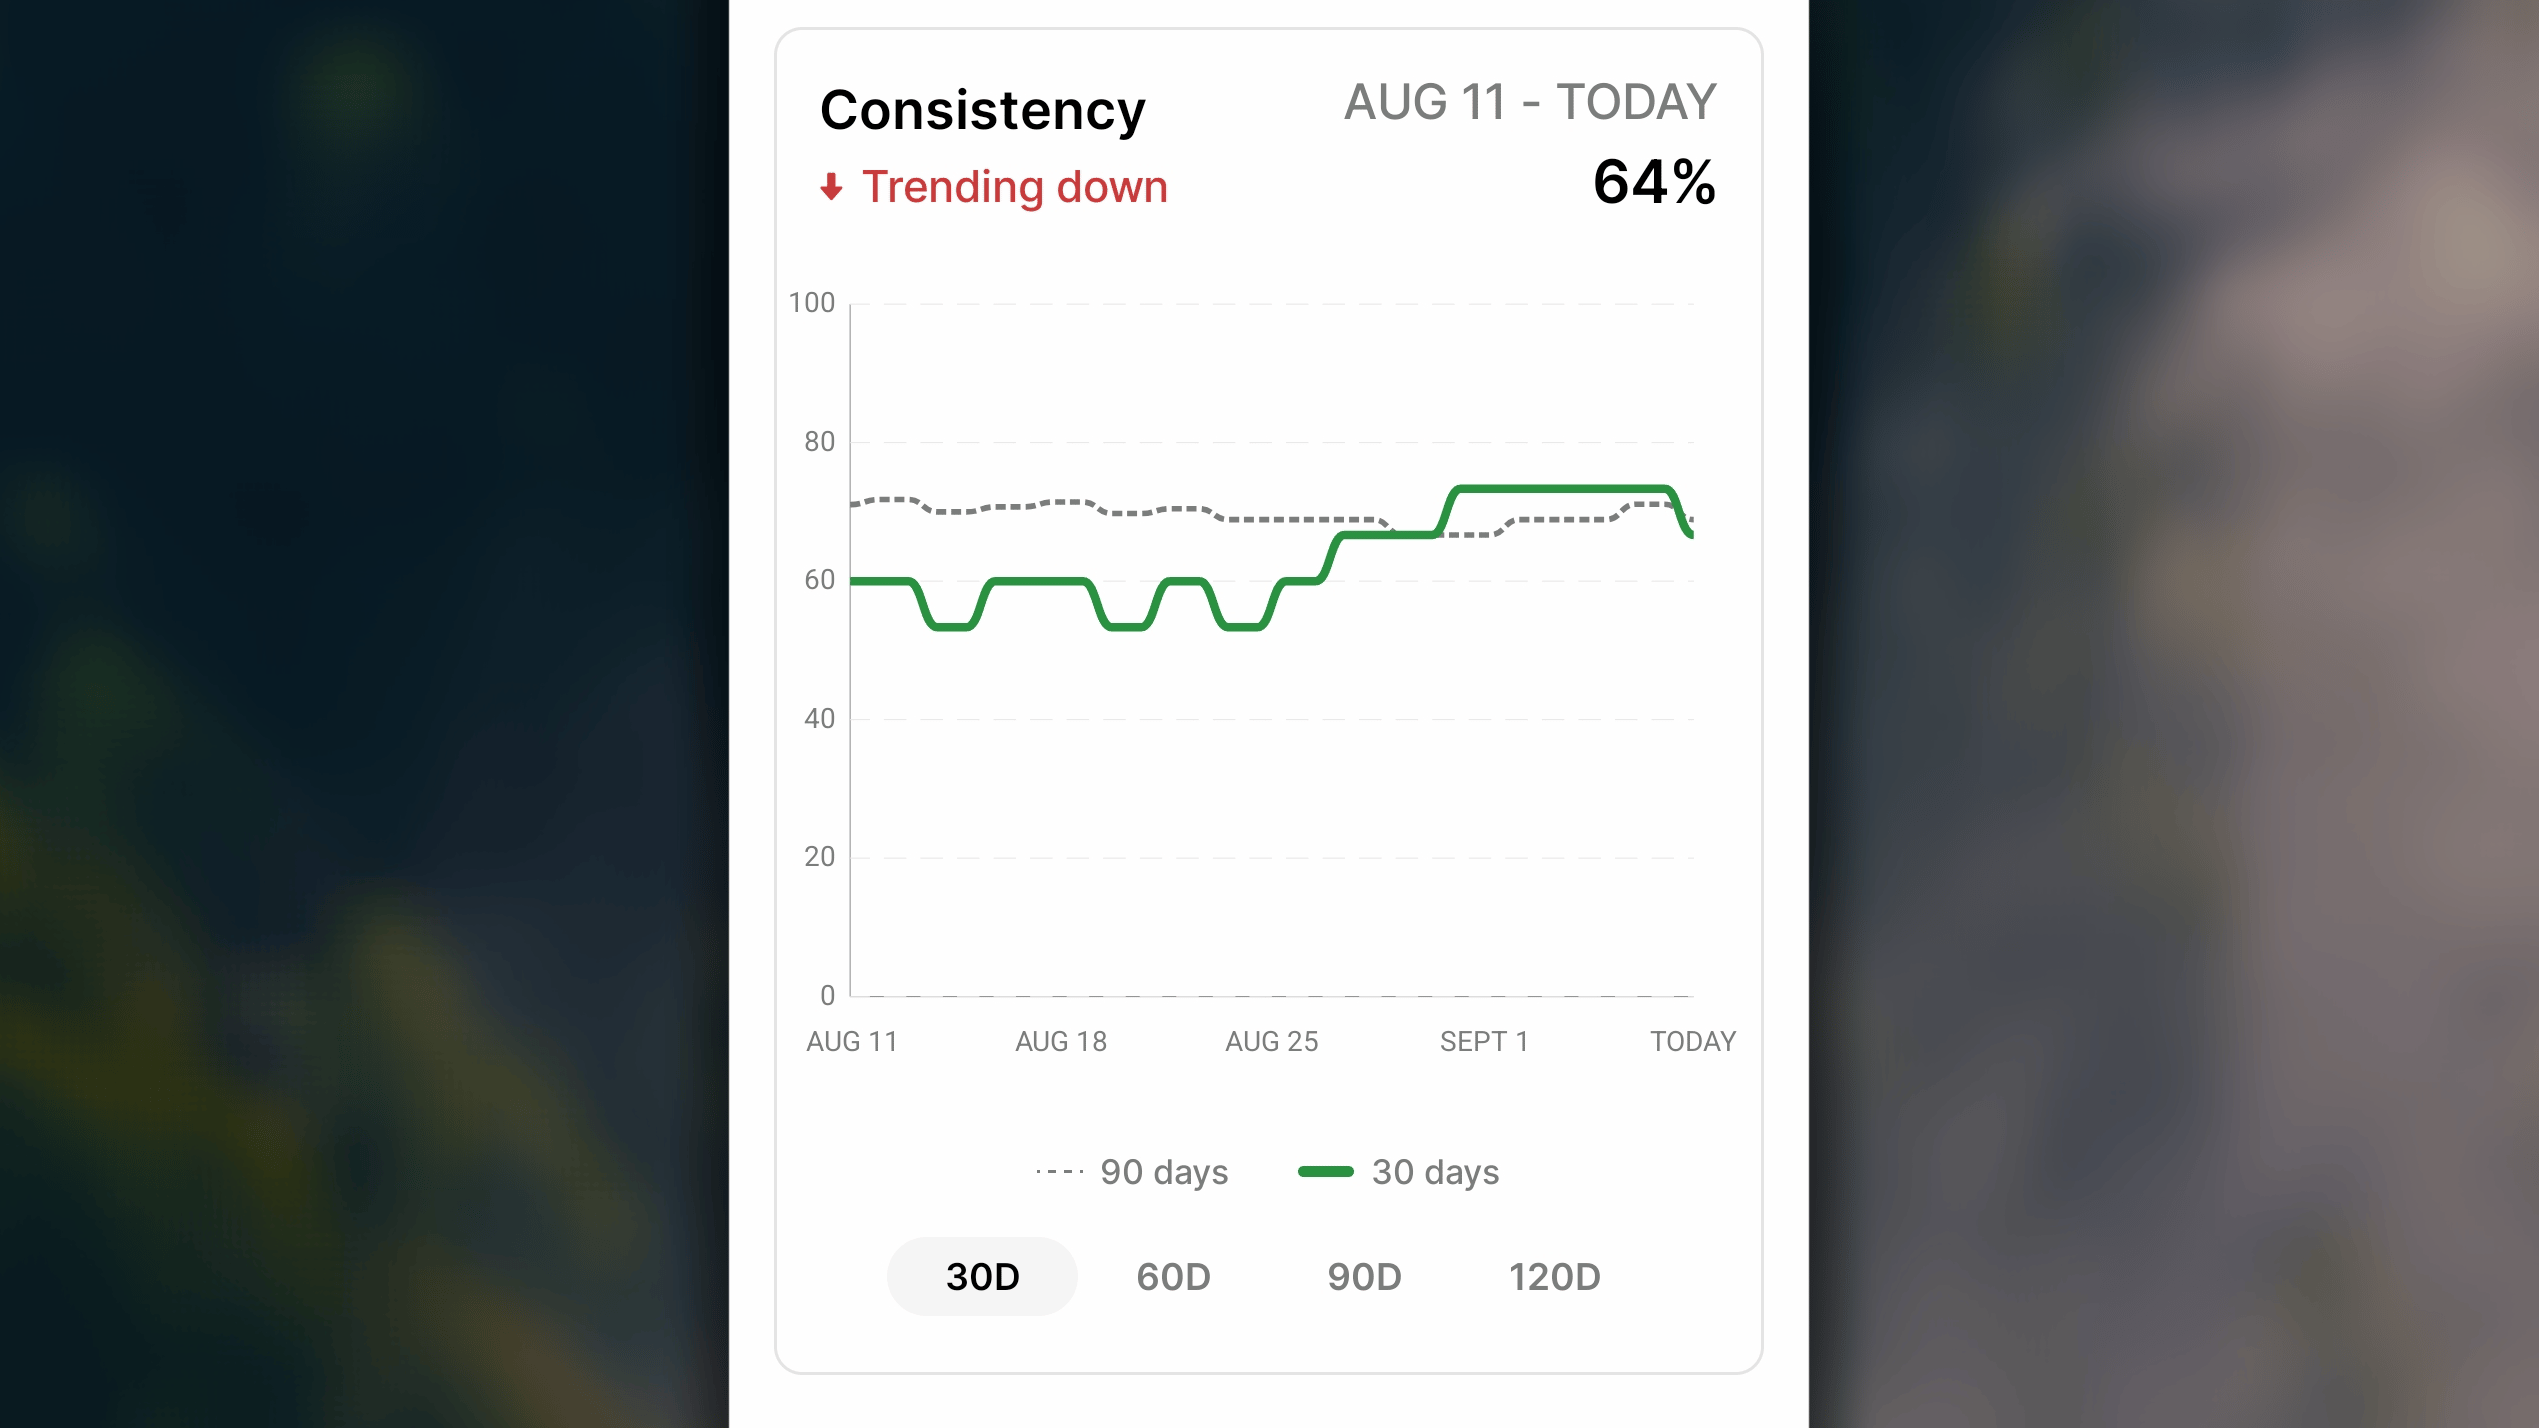
Consistency line chart
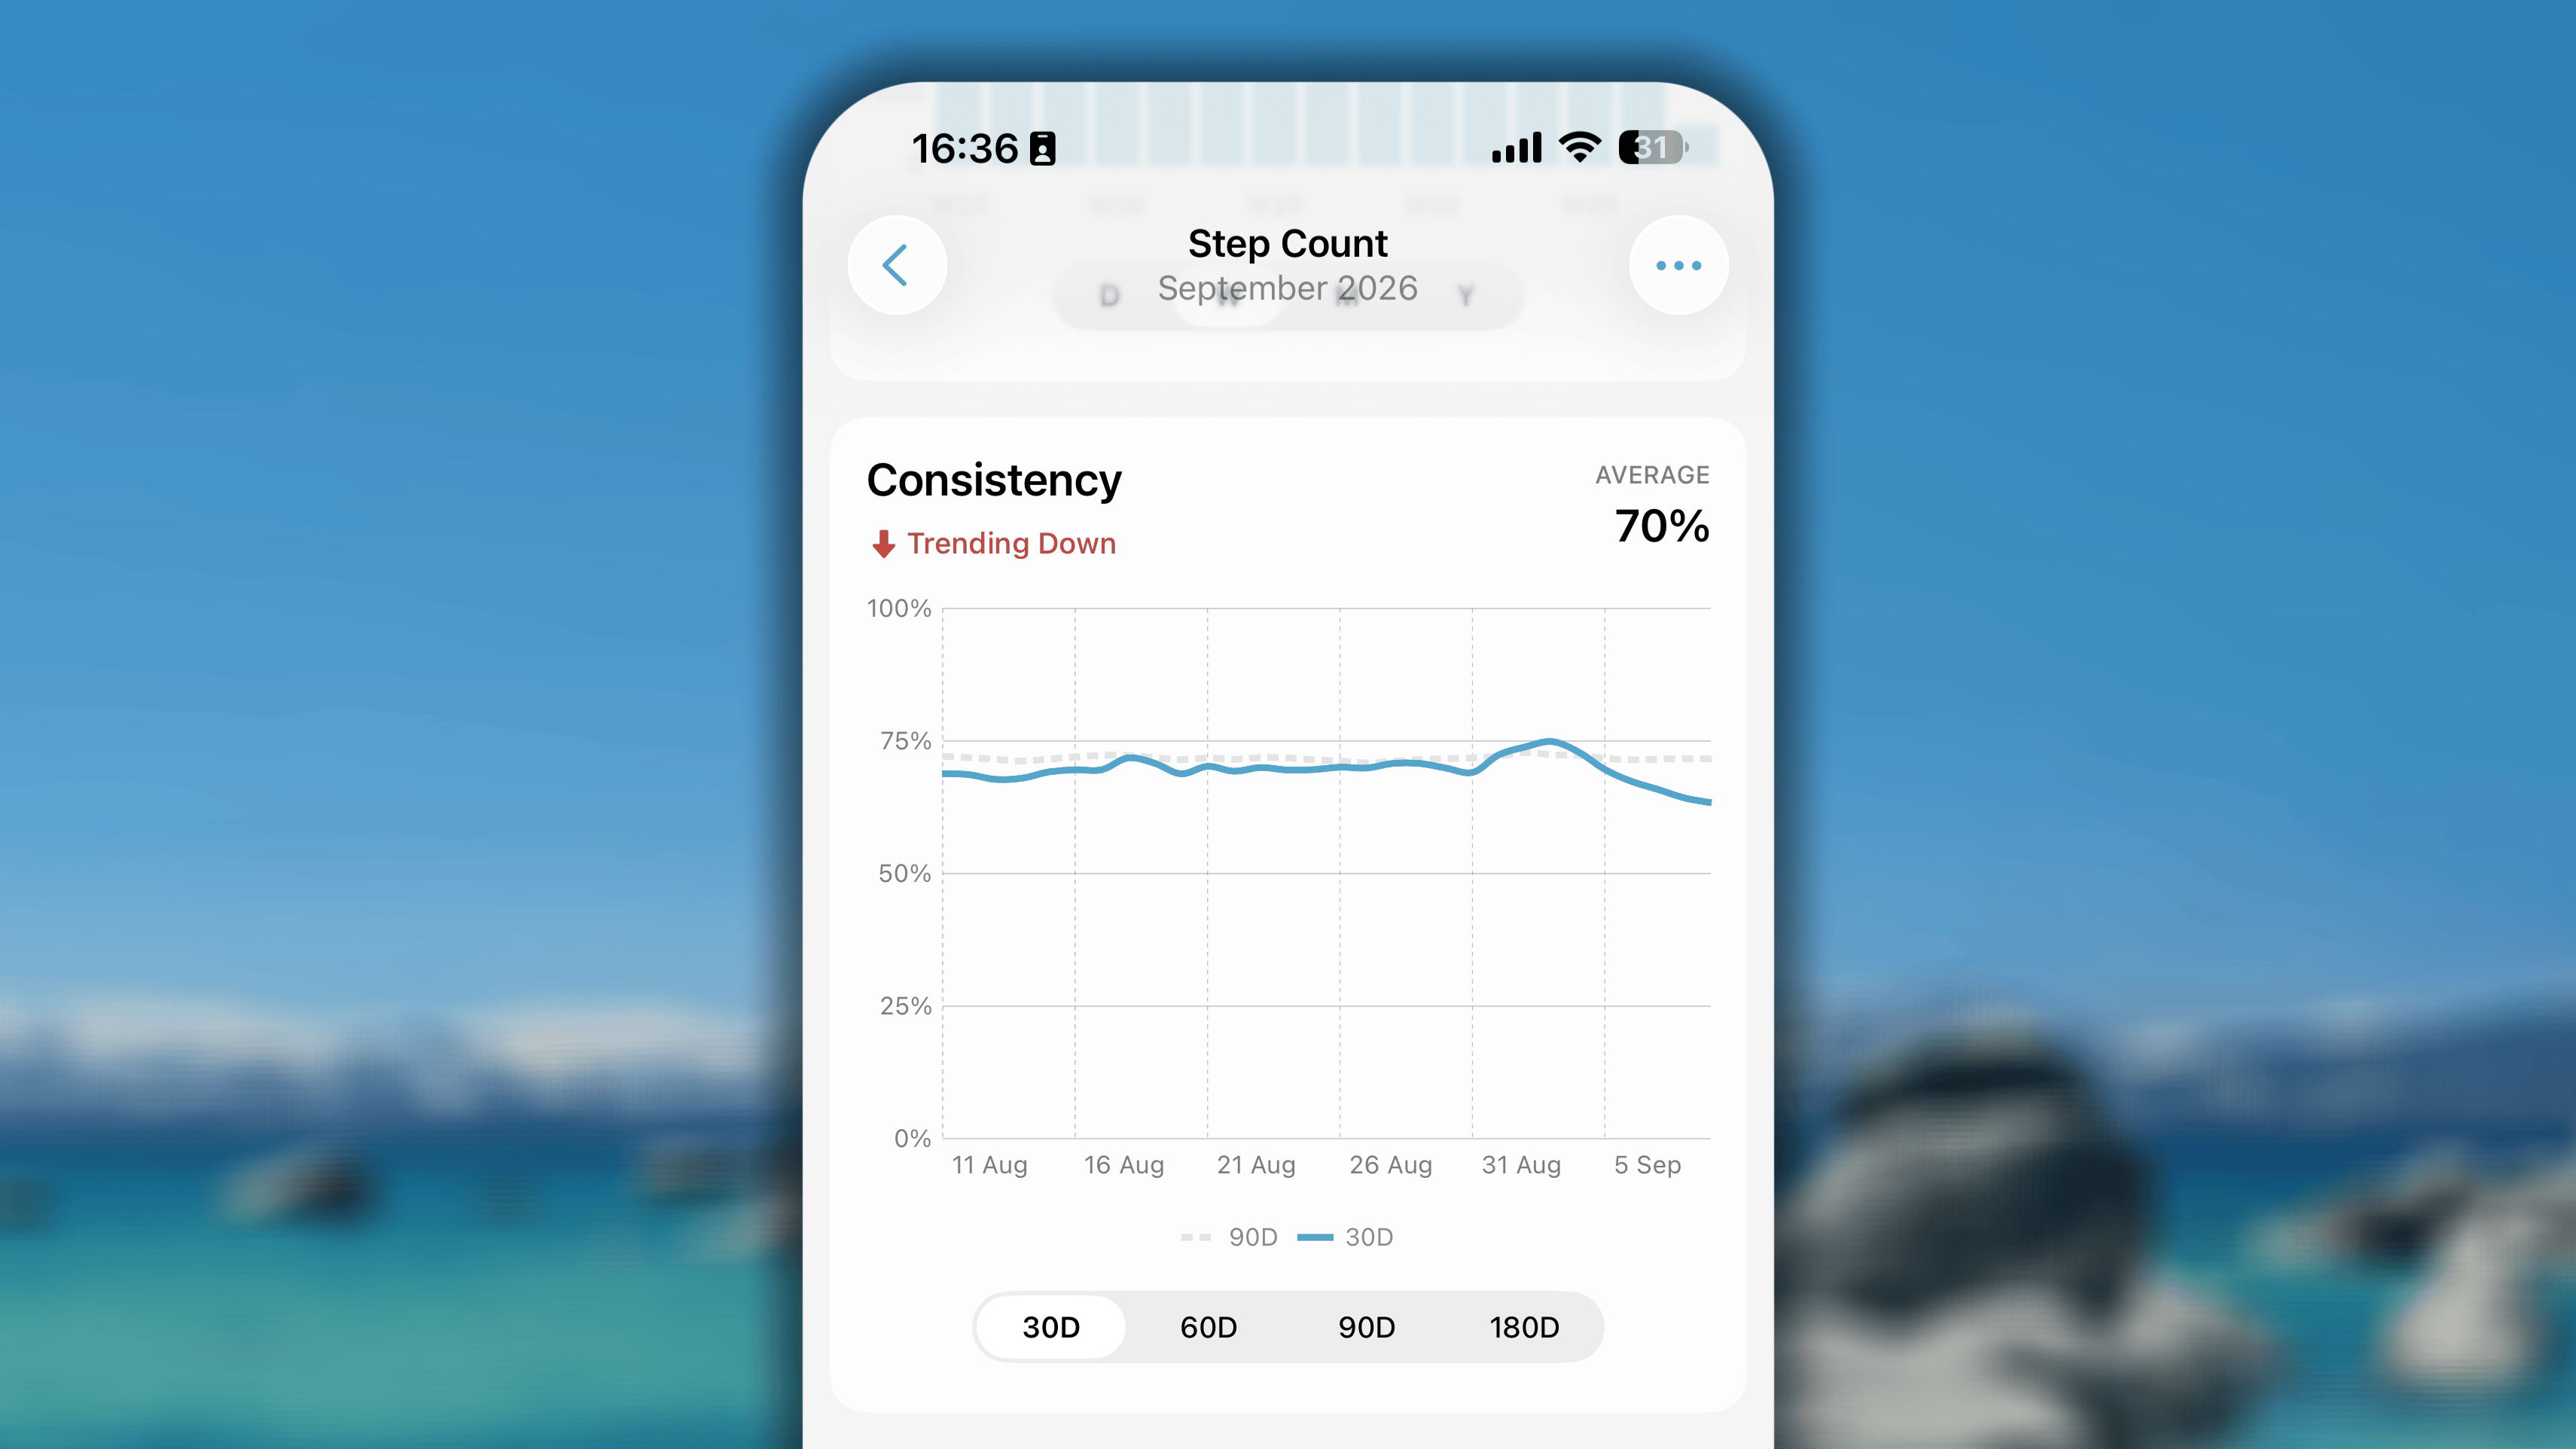
To make this clear, let’s use a simple 3-day period for a habit.Day 1: You complete the habit.
- Daily Value: 100%
- Daily Consistency for Day 1: 100% (the average of the last 3 days, but only Day 1 exists)
- Daily Value: 50%
- Daily Consistency for Day 2: (100% [Day 1] + 50% [Day 2]) / 2 = 75%
- Daily Value: 0%
- Daily Consistency for Day 3: (100% [Day 1] + 50% [Day 2] + 0% [Day 3]) / 3 = 50%
(100% + 75% + 50%) / 3 = 75%- For the last 30D view, the dashed line shows your average from the previous 60 days.
- For the last 60D view, the dashed line shows your average from the previous 120 days.
- For the last 90D view, the dashed line shows your average from the previous 180 days.
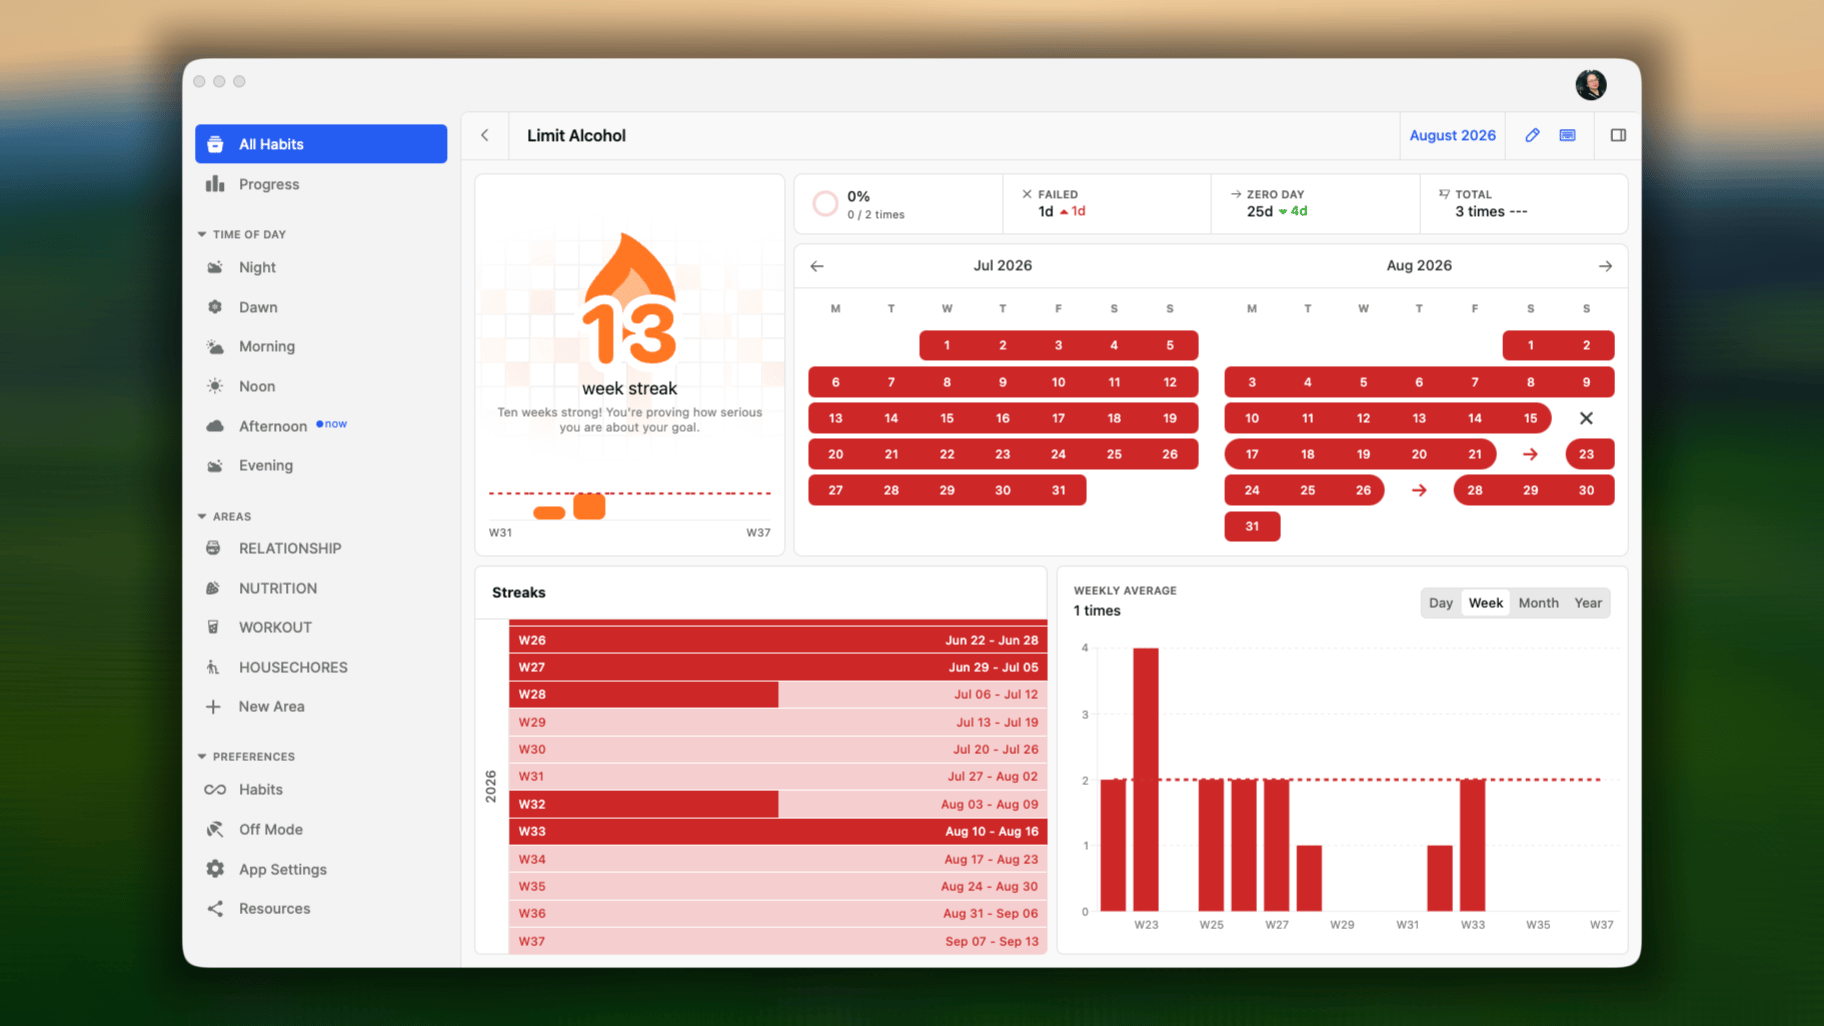
Bad habit’s single progress
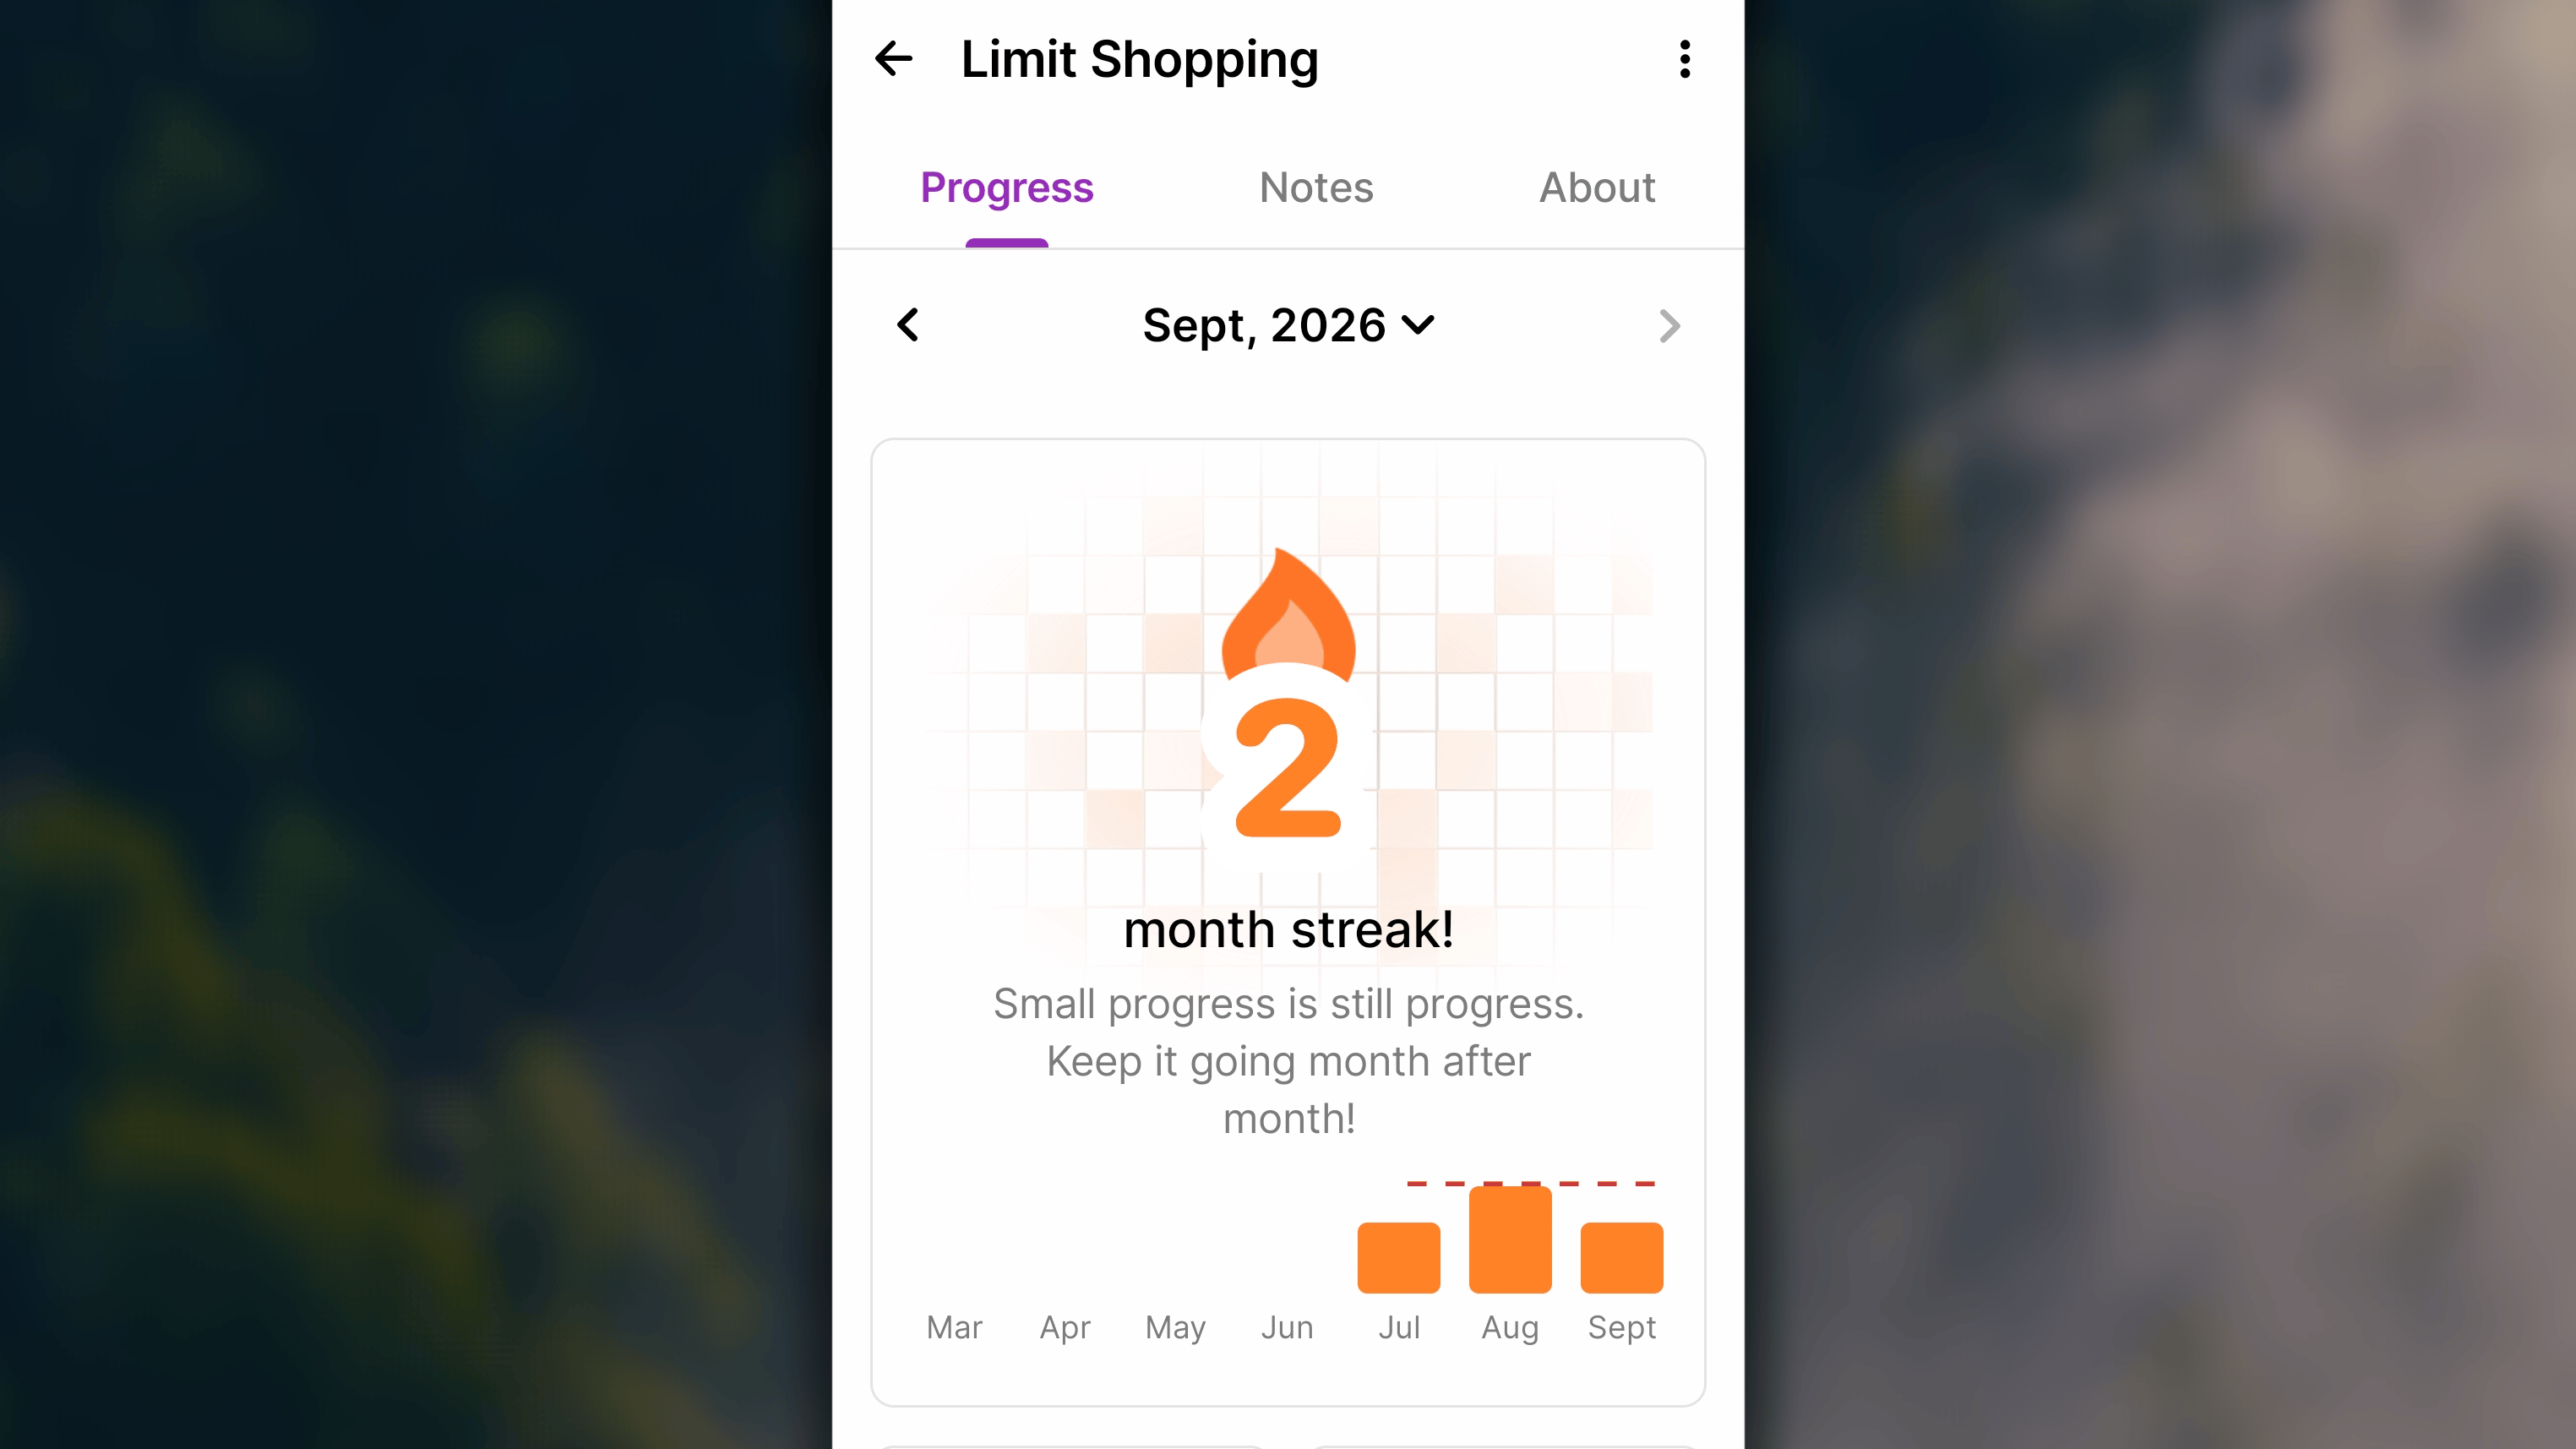
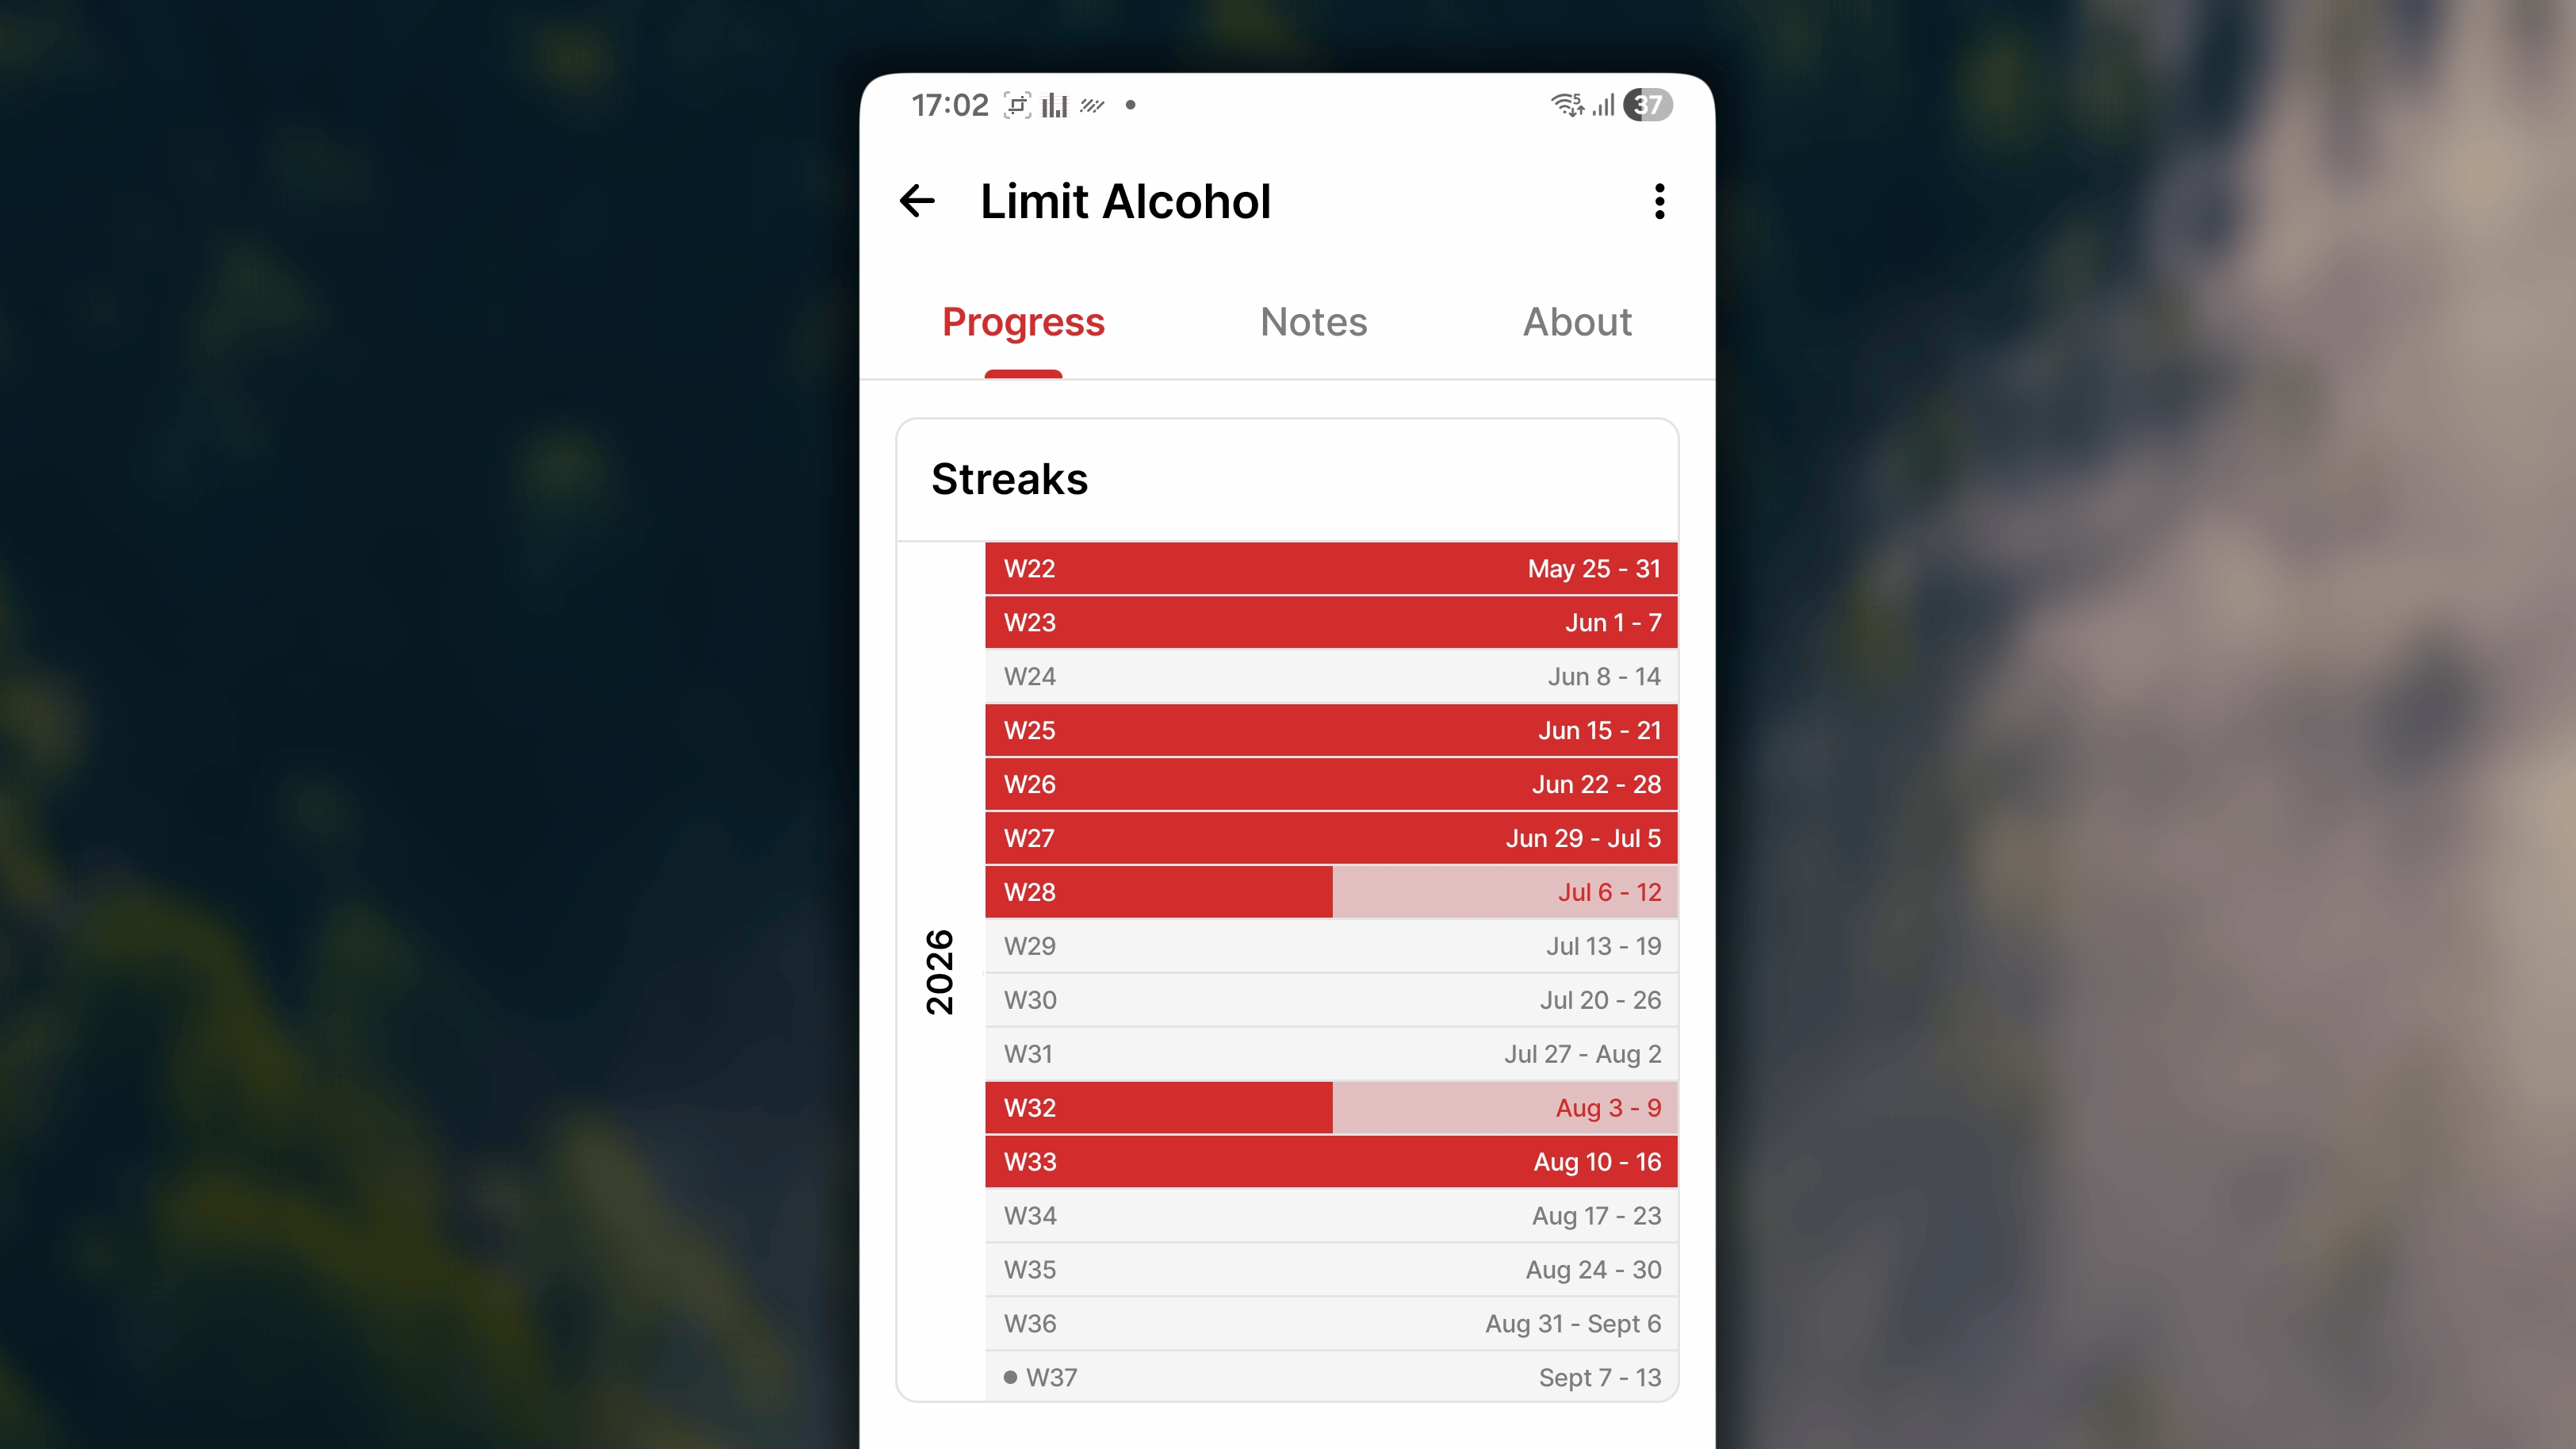
Current Streak
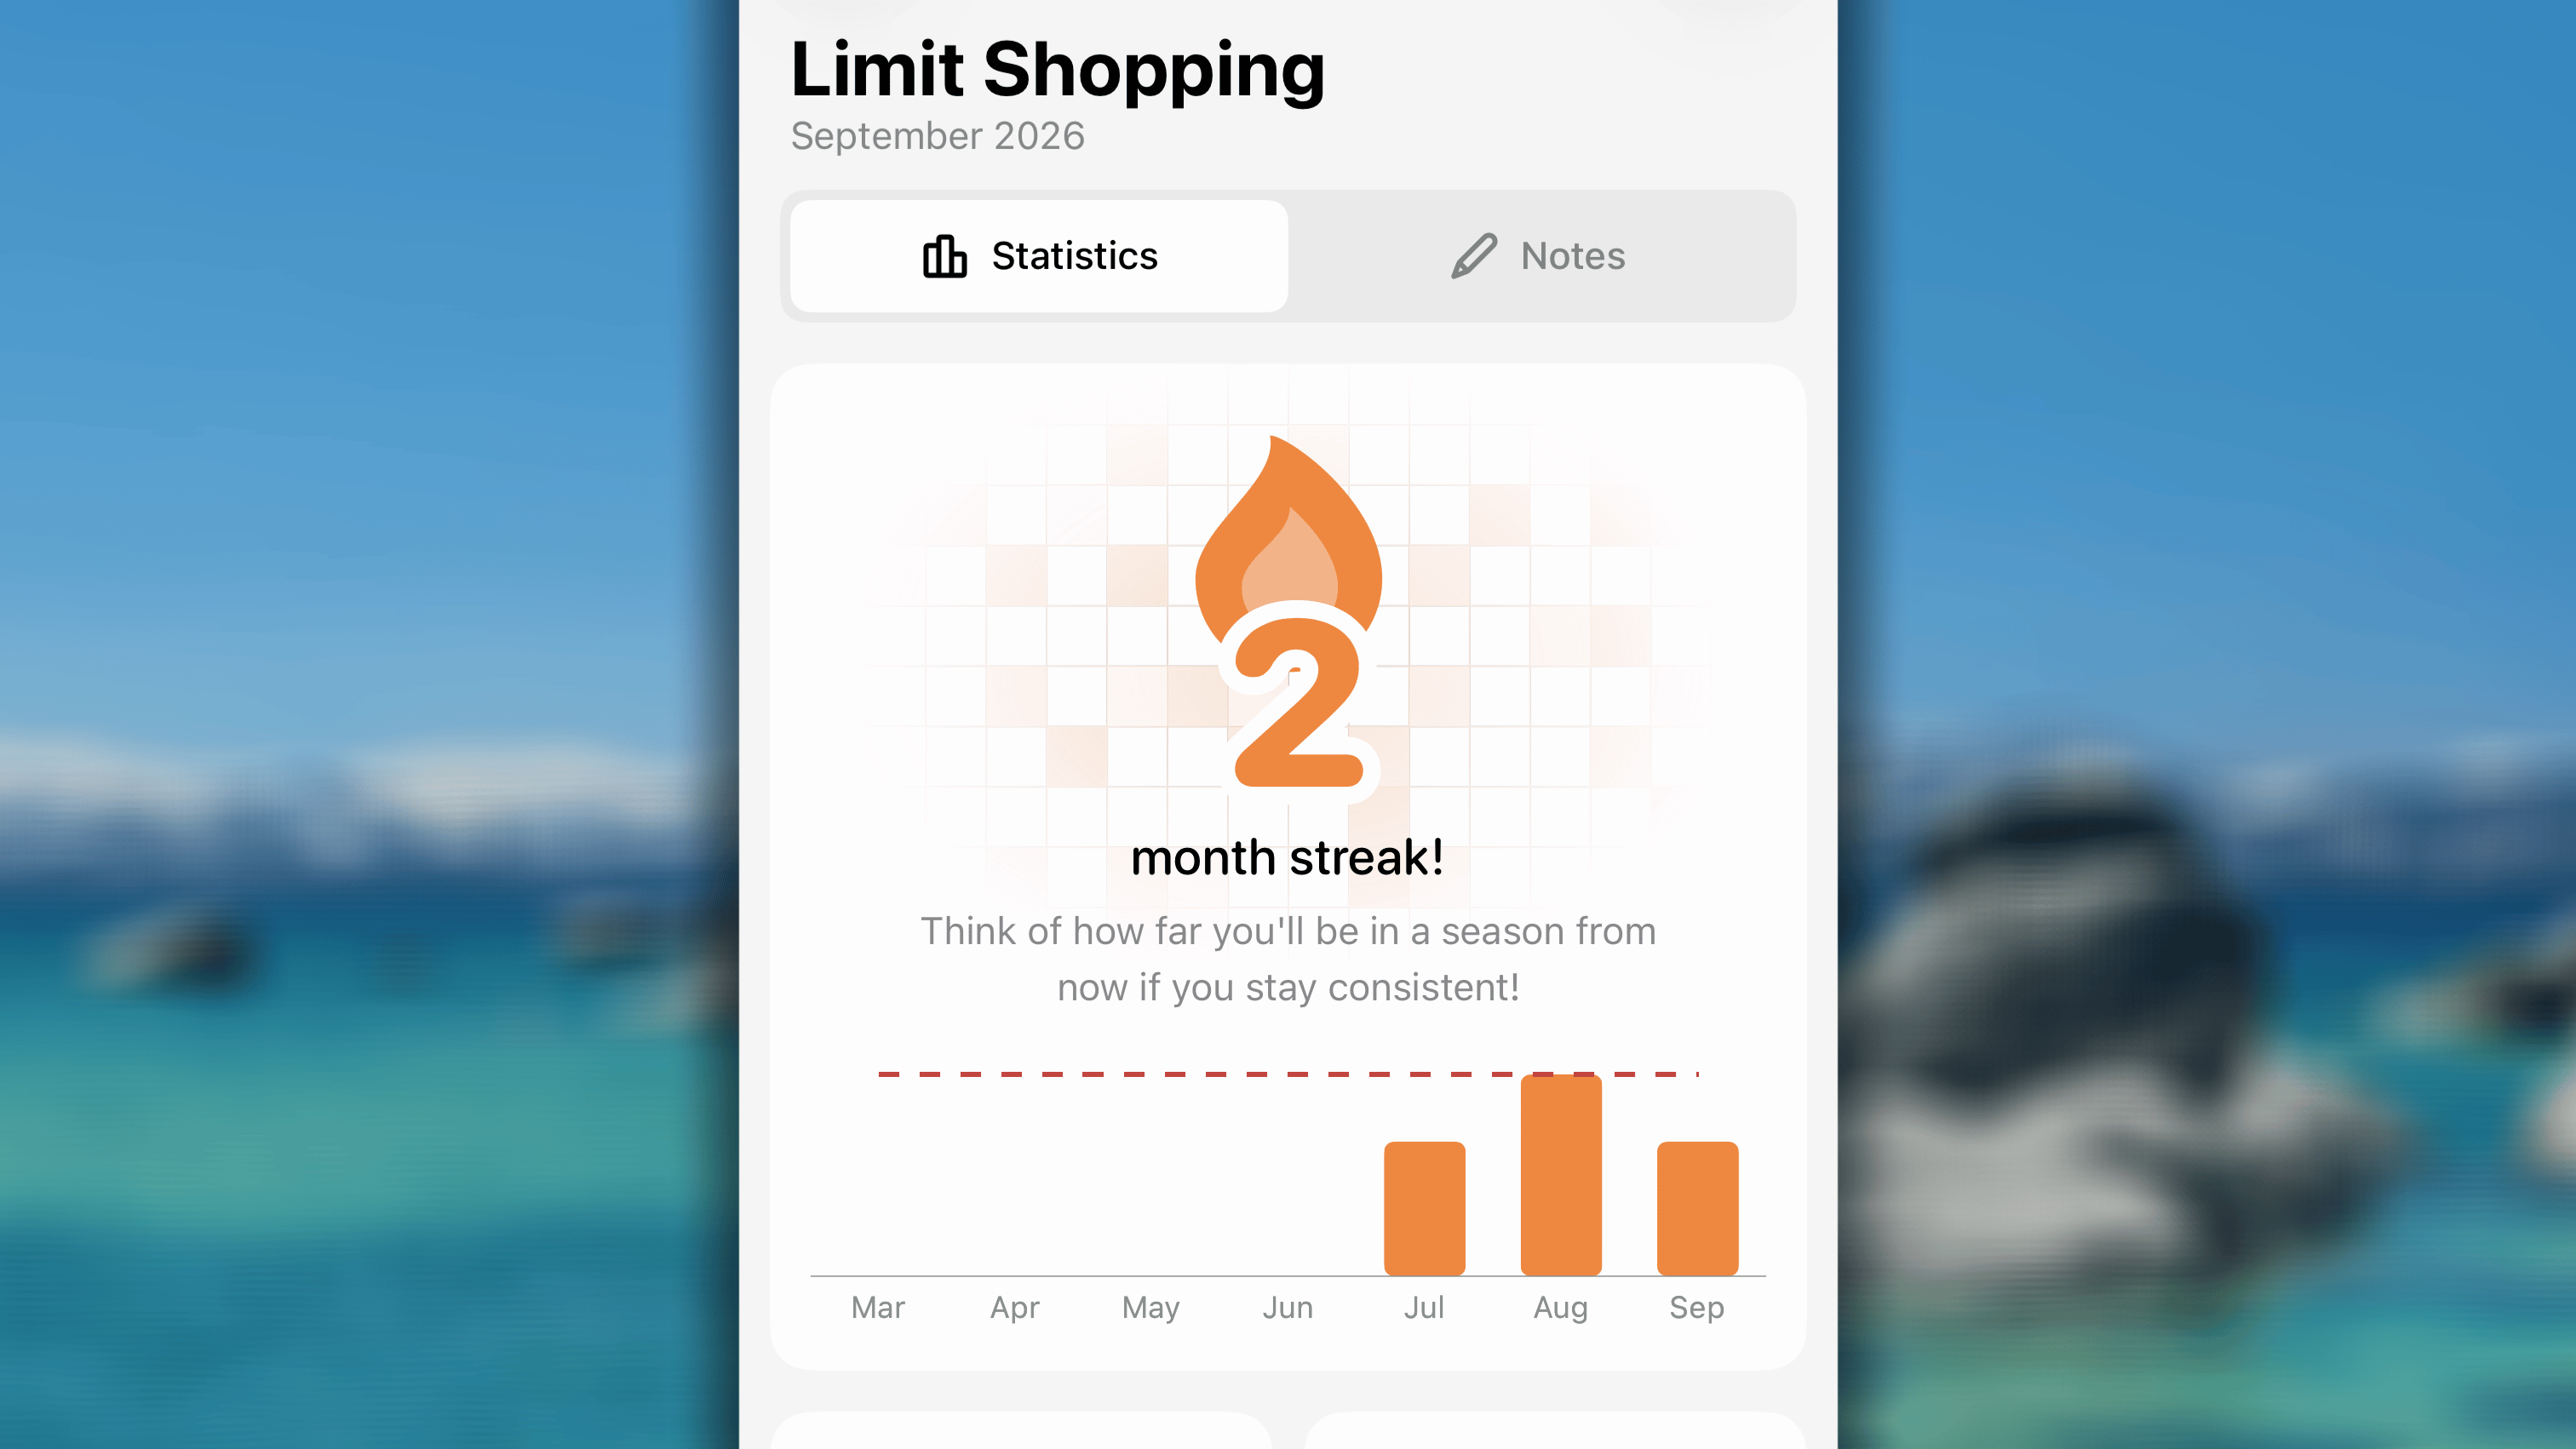
- Goal to limit per day: Streak increases when a day is marked as suceeded.
- Goal to limit per week: Streak increases when you keep your doings under the weekly limitation.
- Goal to limit per month: Streak increases when you keep your doings under the monthly limitation.
- Goal to limit per year: Streak increases when you keep your doings under the annual limitation.
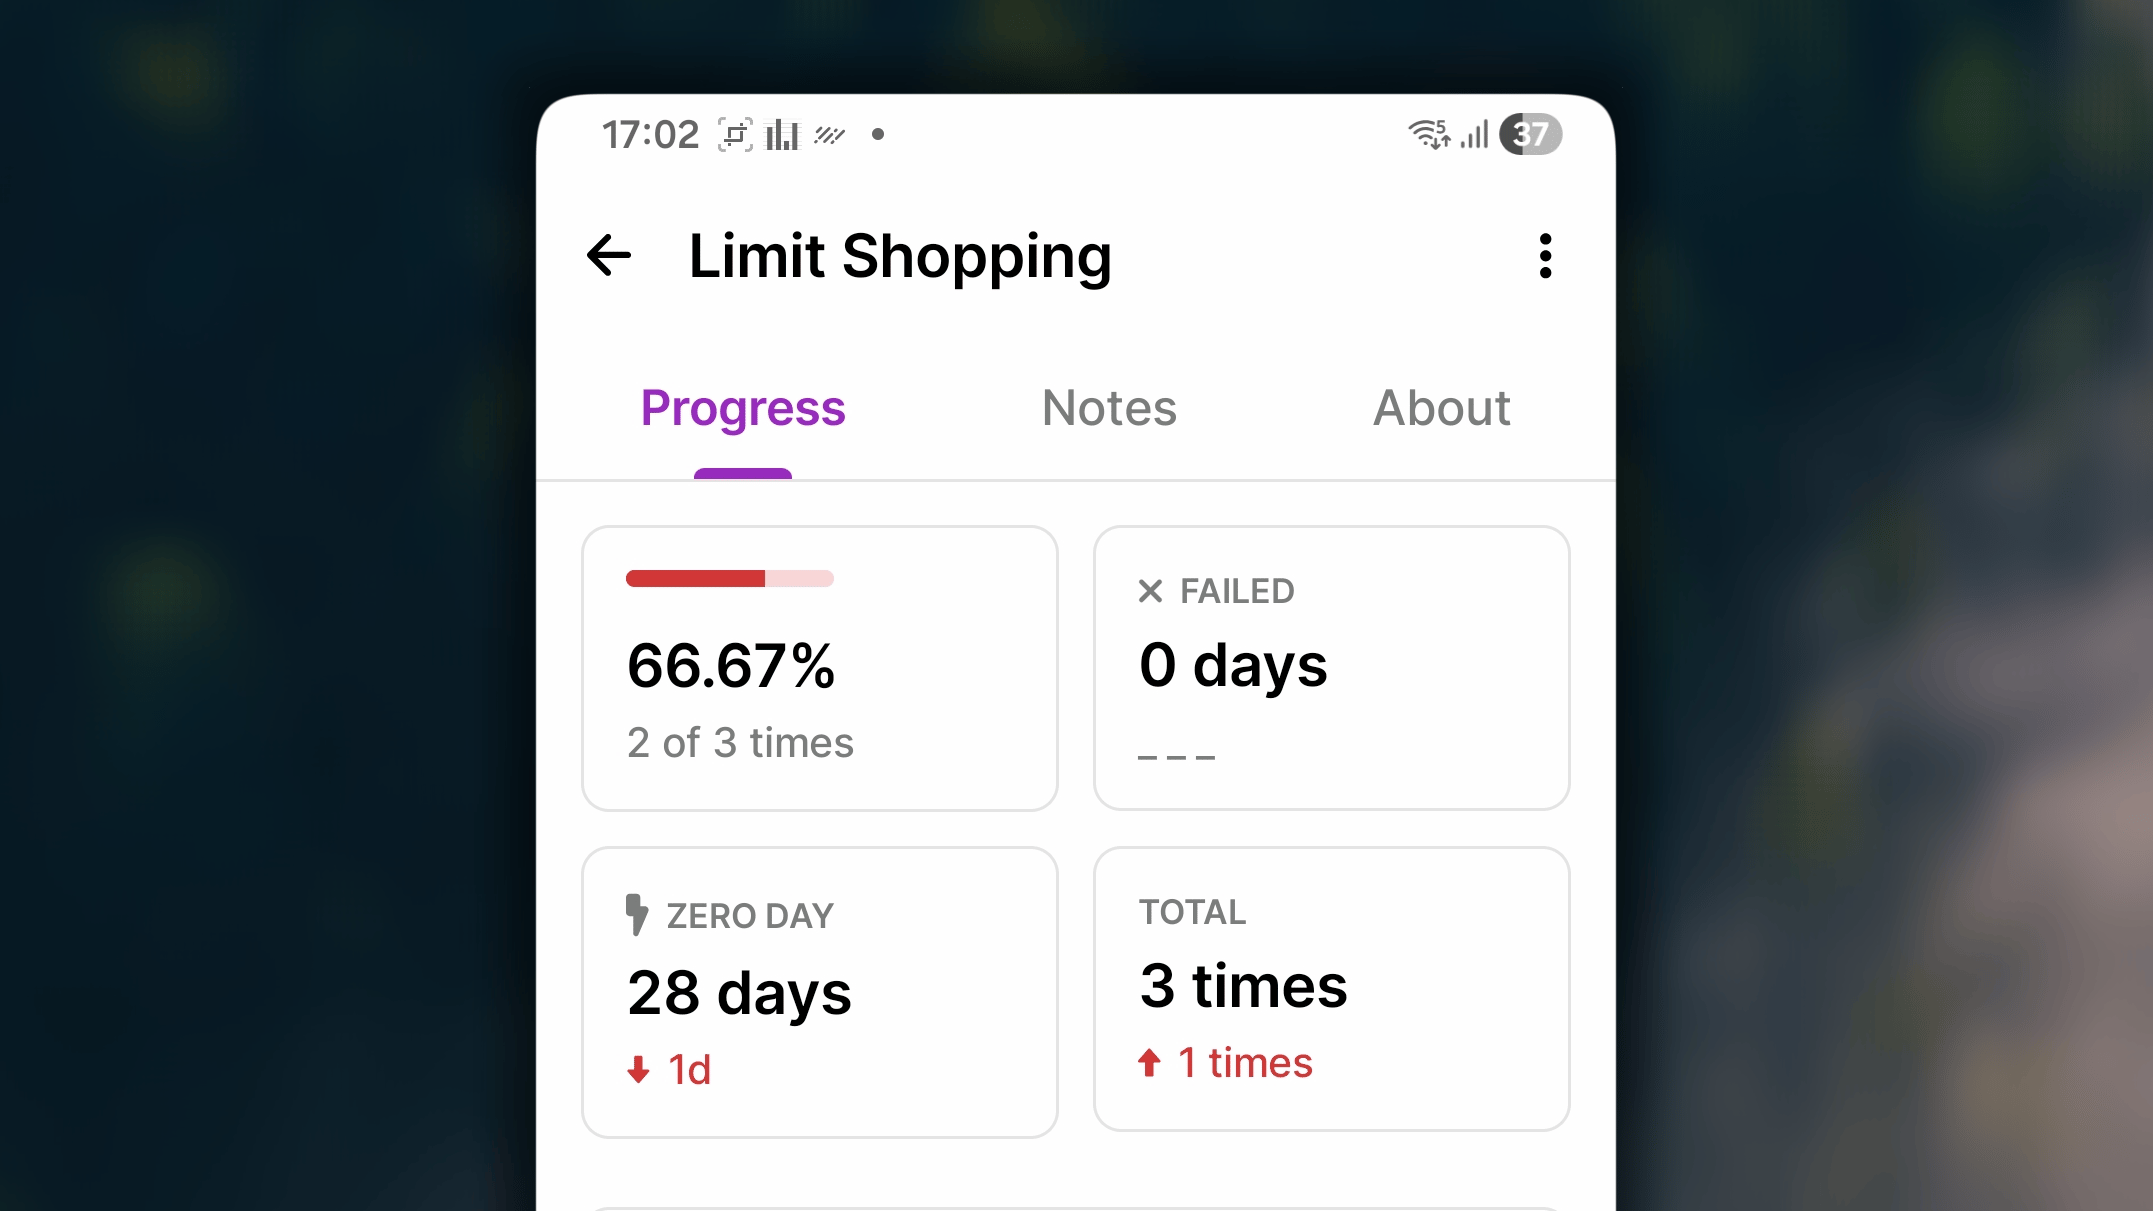
Core indexes
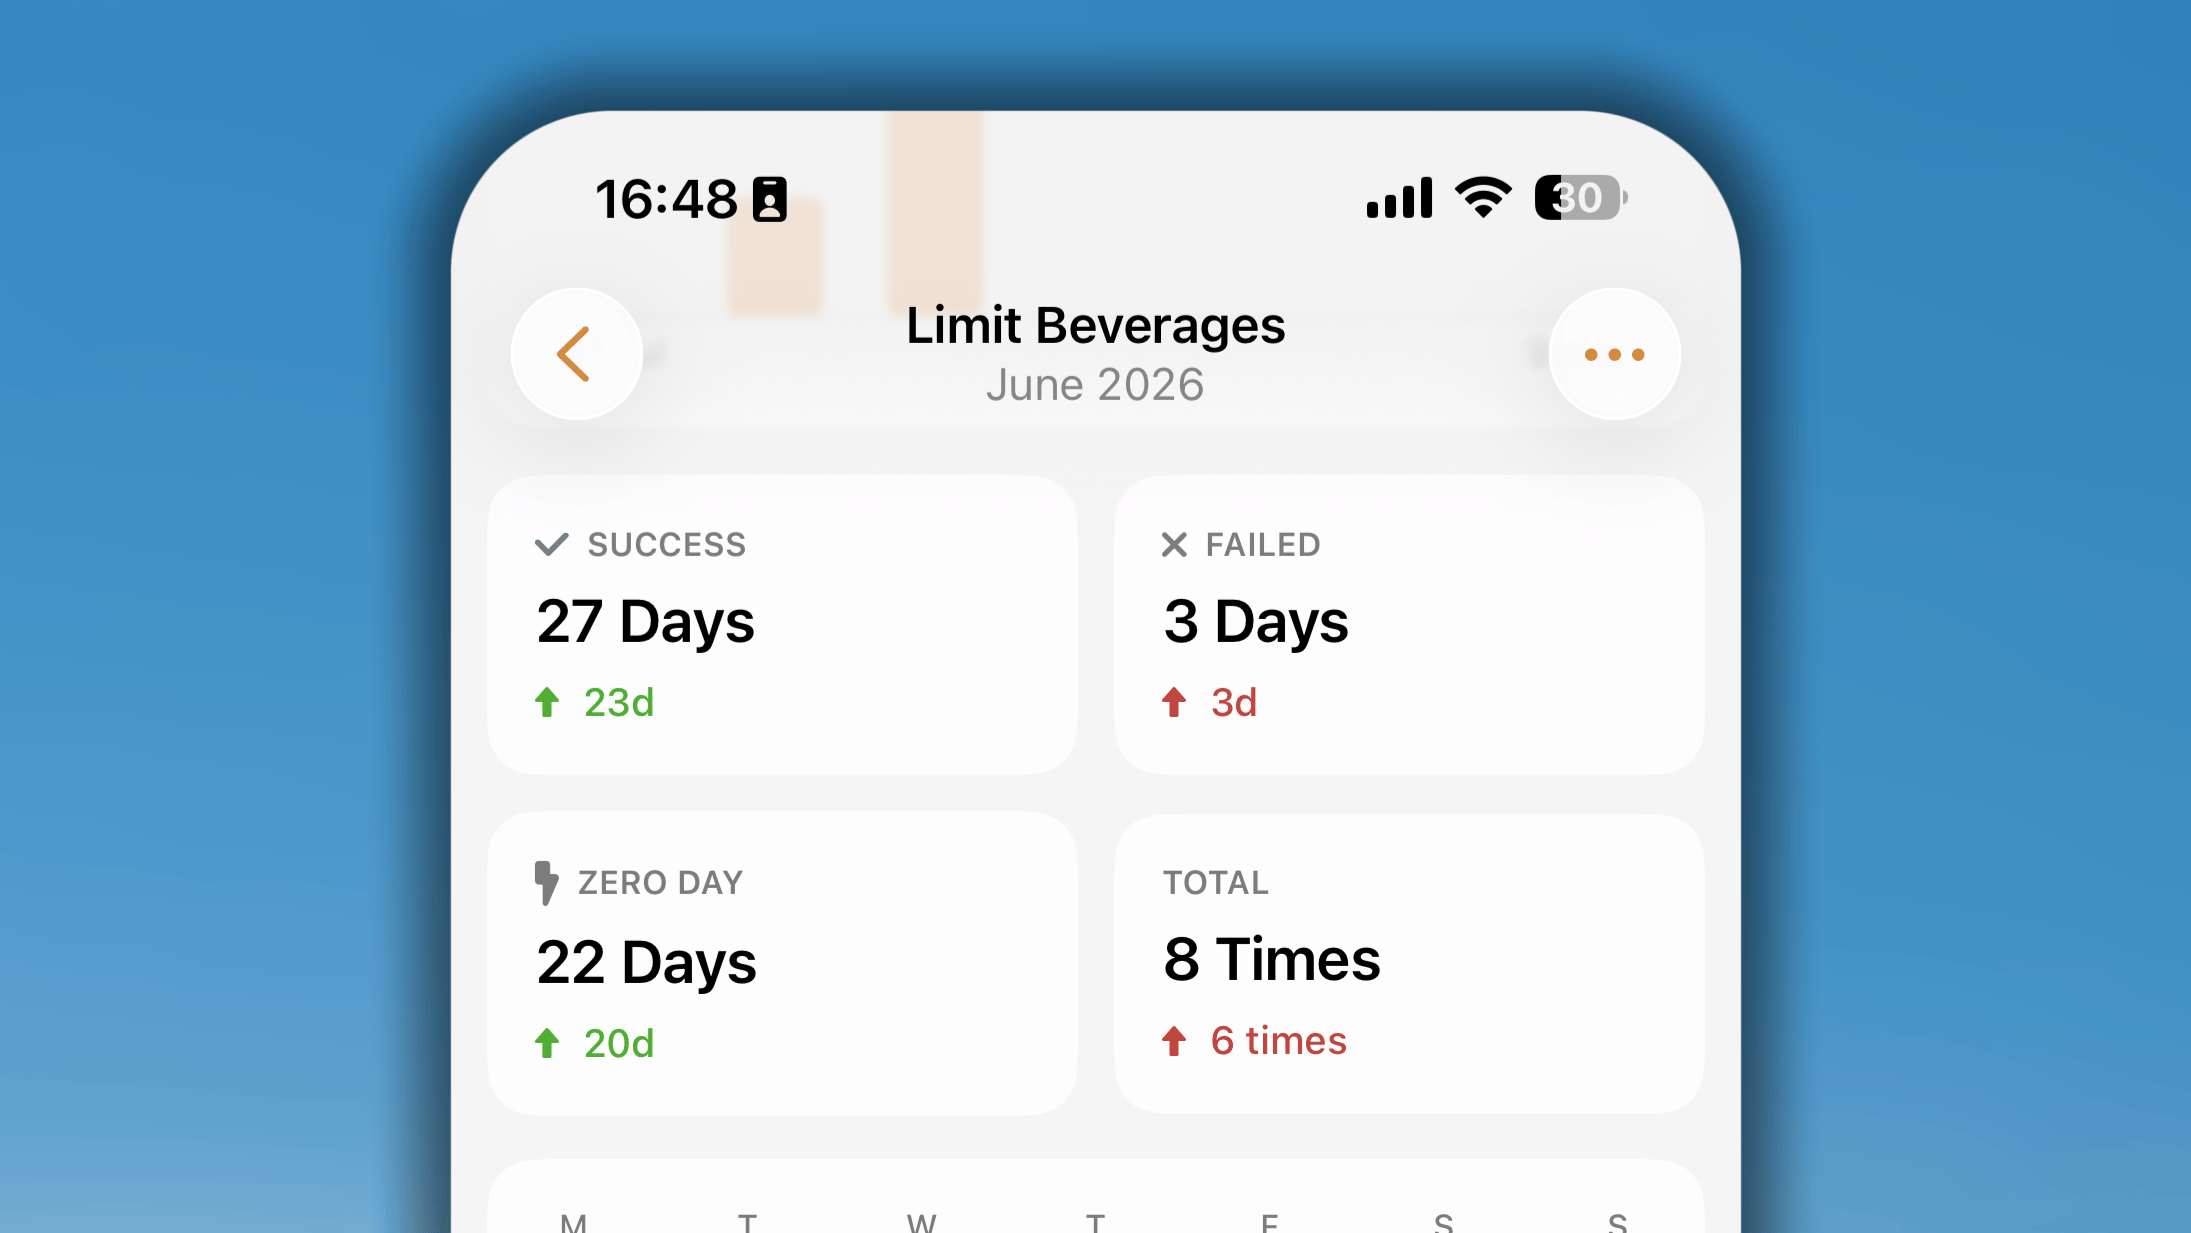
- Success: The total number in the selected time range you succeed not doing the bad habit or doing under the limitation.
- Failed: The total number of failed days in the selected time range on which you make your habit more than the limitation.
- Zero-Day (with Limit goal only): The number of days you are not doing the habit at all.
- Total (with Limit goal only): The total amount indicating how you perform your bad habits. For example, if your goal unit is “mins”, the total number will show the total minutes you spent on your habit.
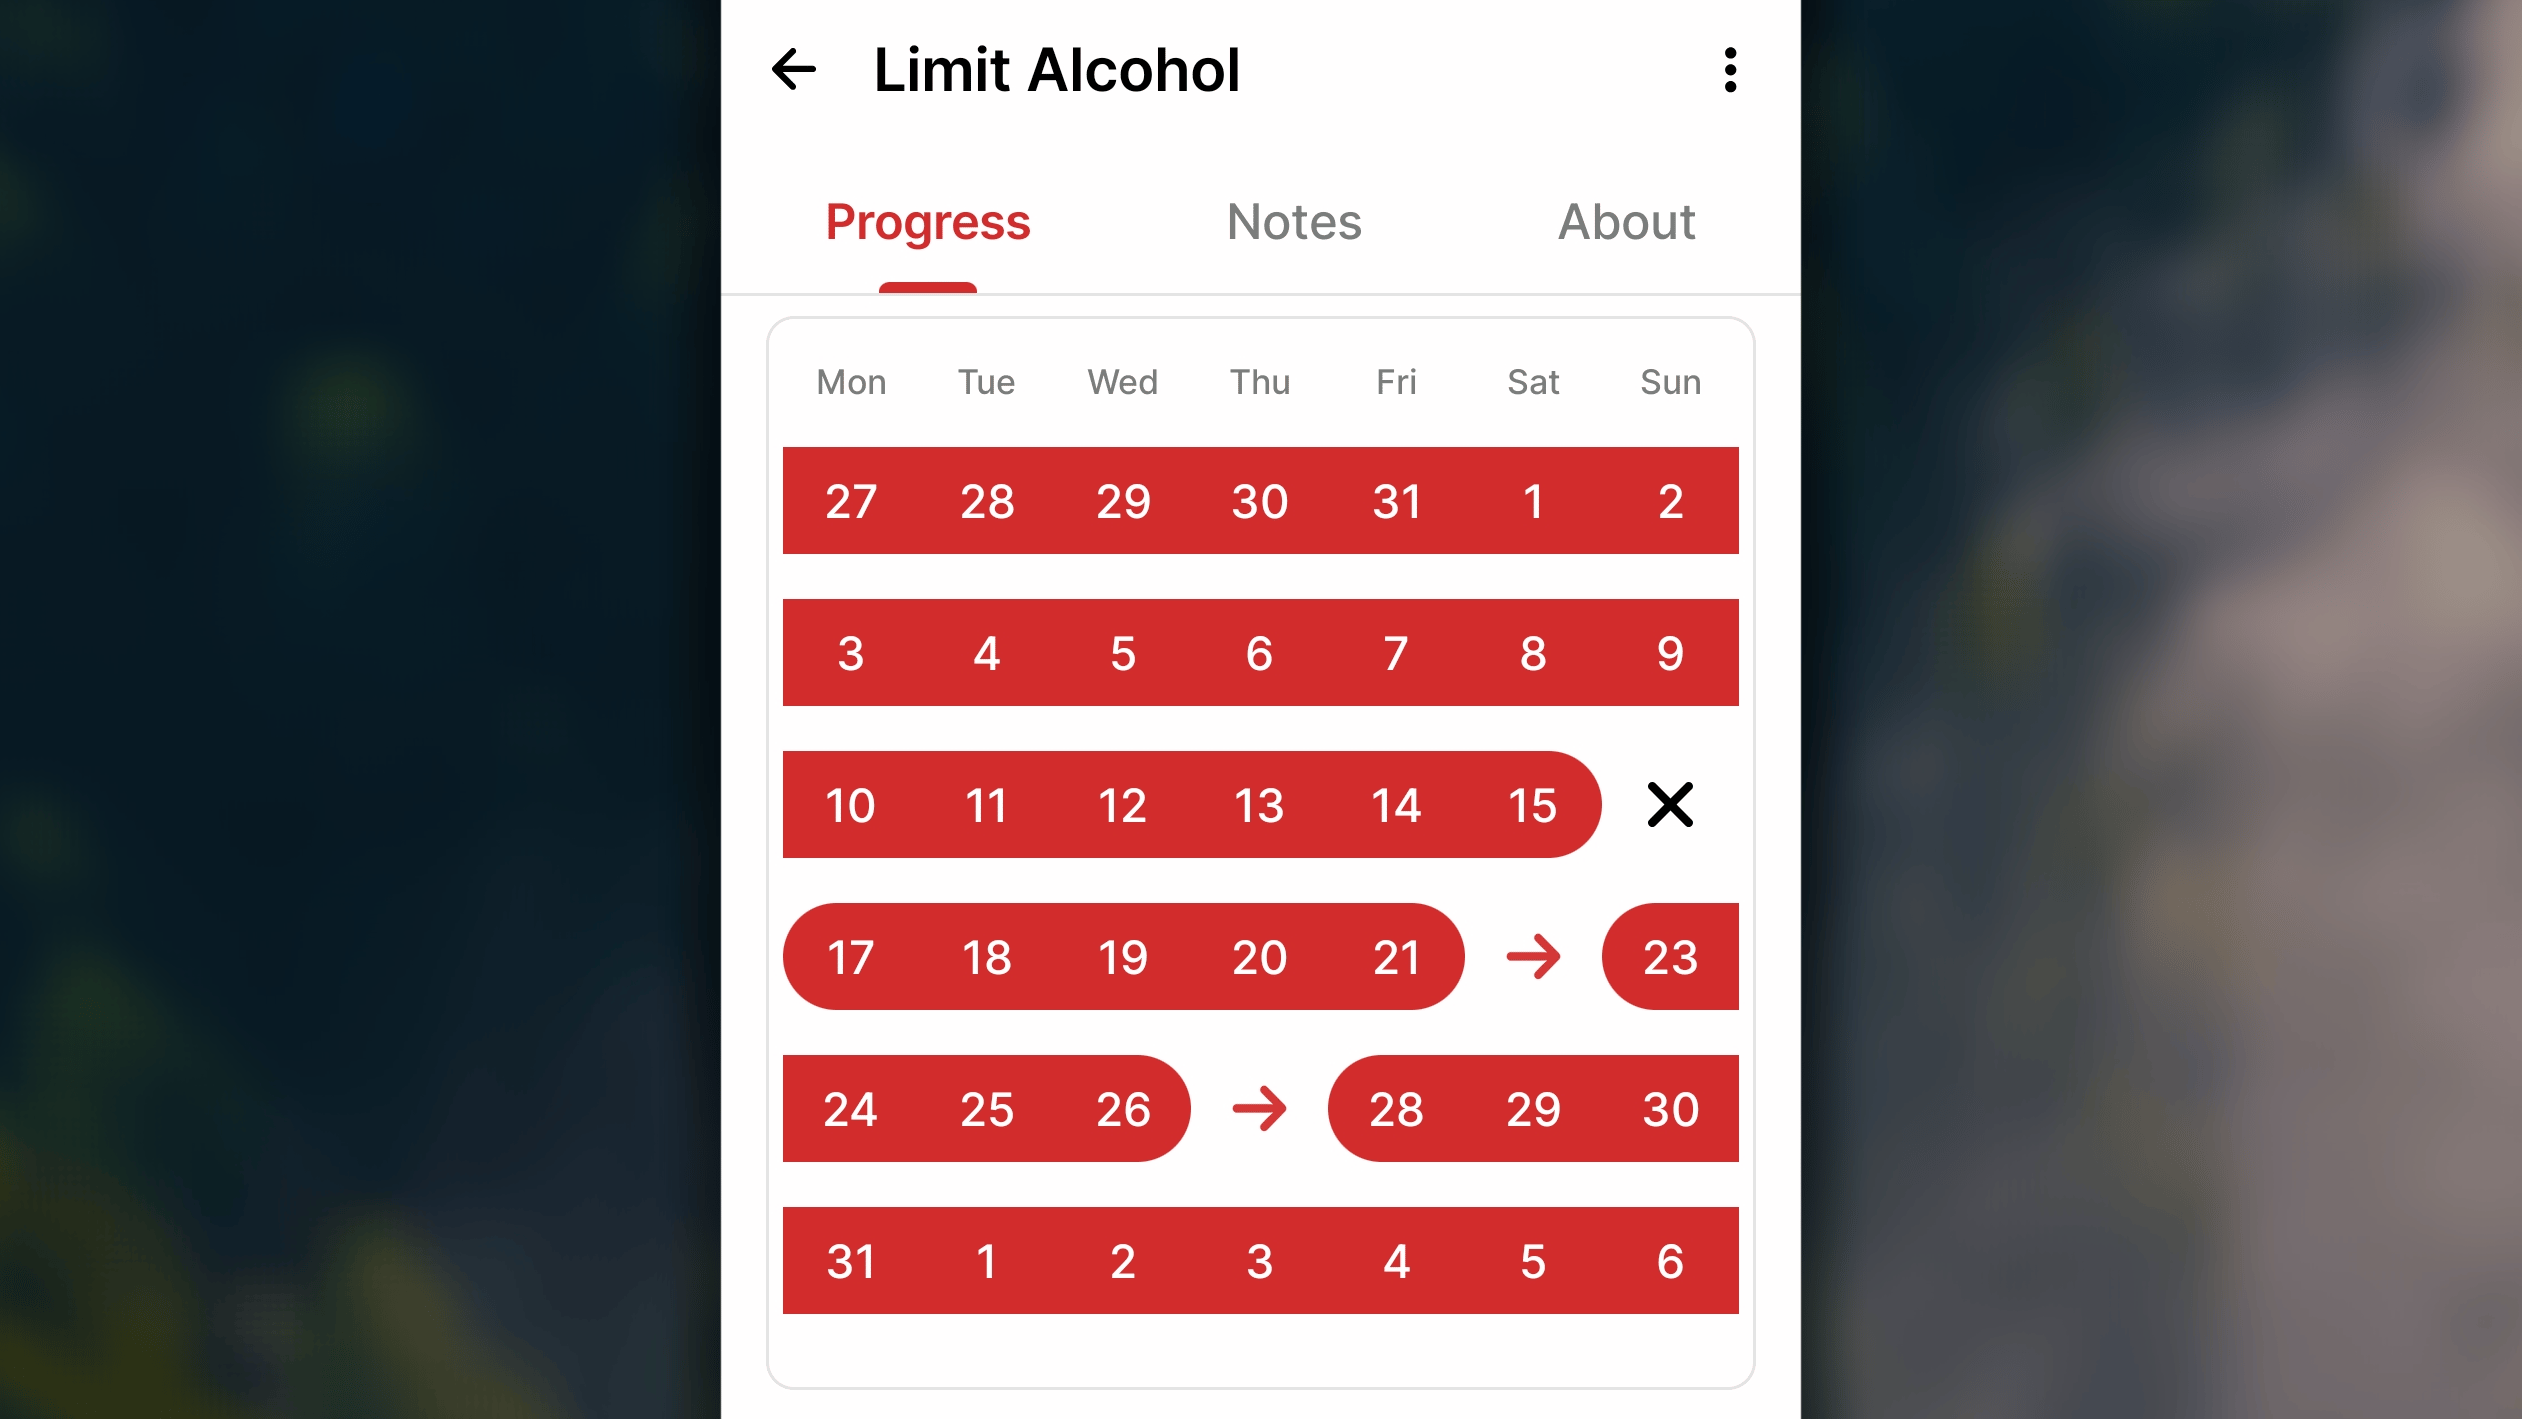
Progress in Calendar
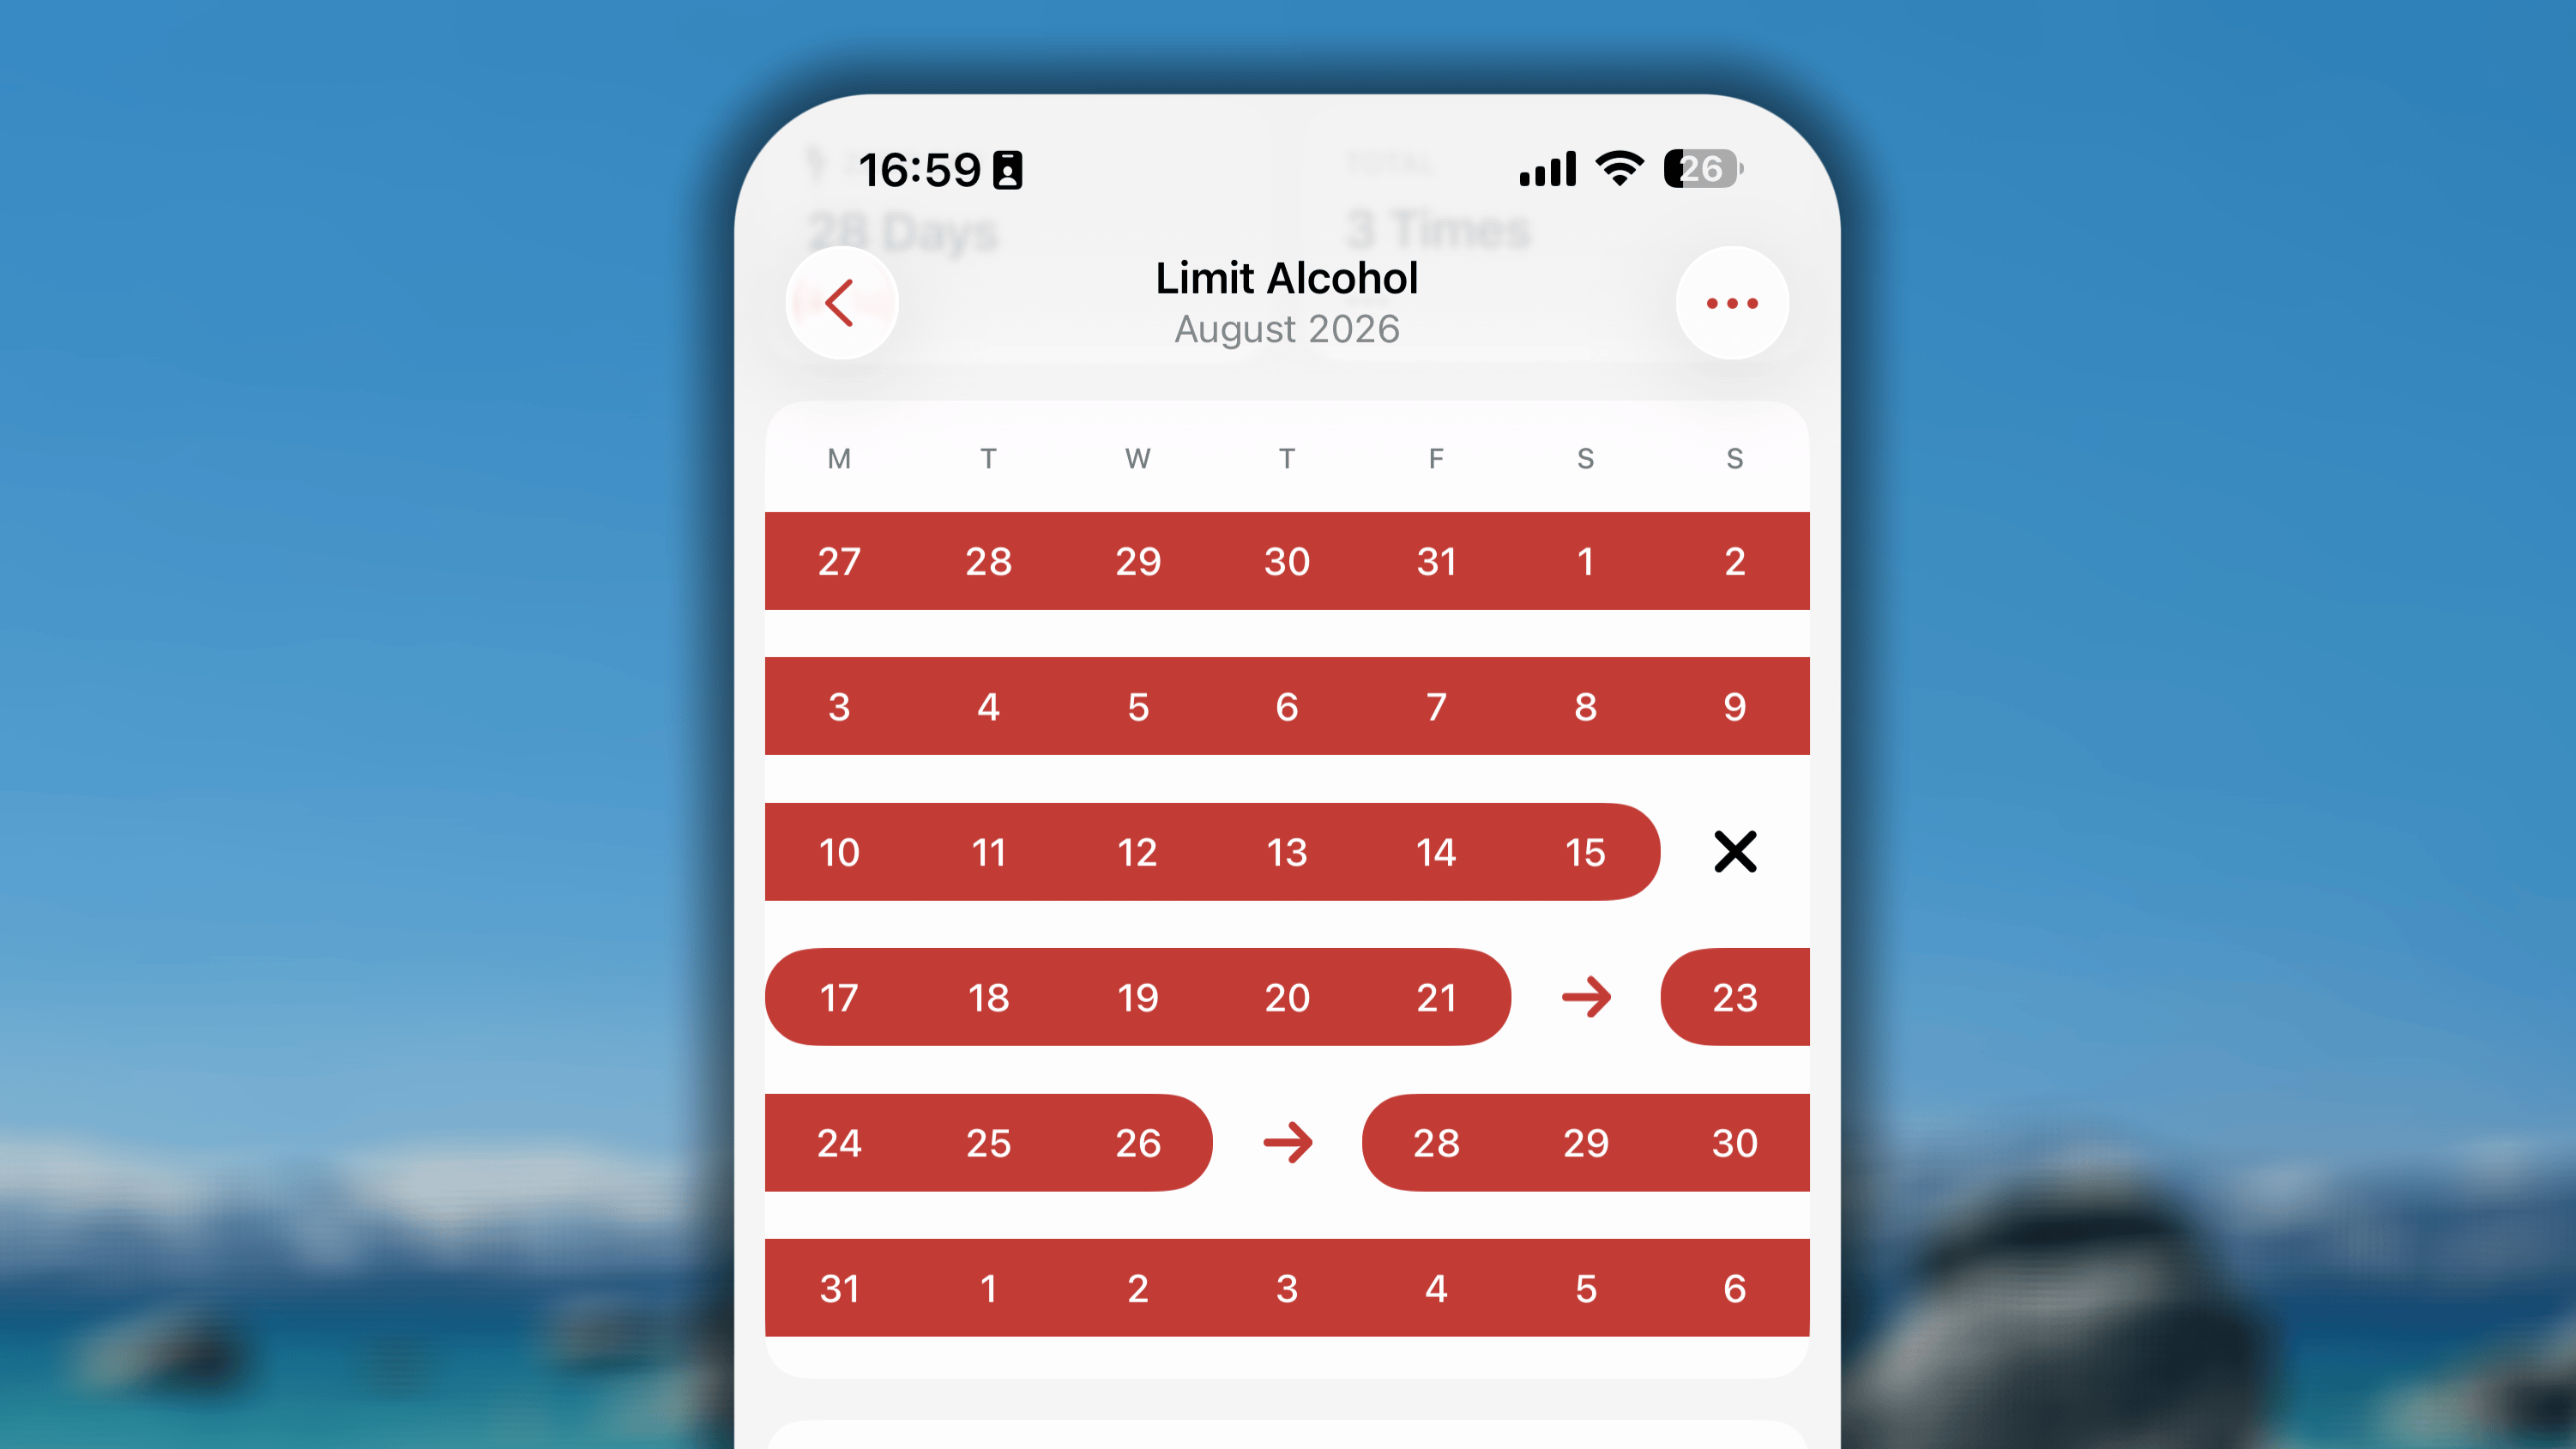
- A solid colored circle: the day you mark your habit as Succeeded.
- An right-headed arrow: the day you mark your habit as Skipped.
- A black cross: the day you mark your habit as Failed.
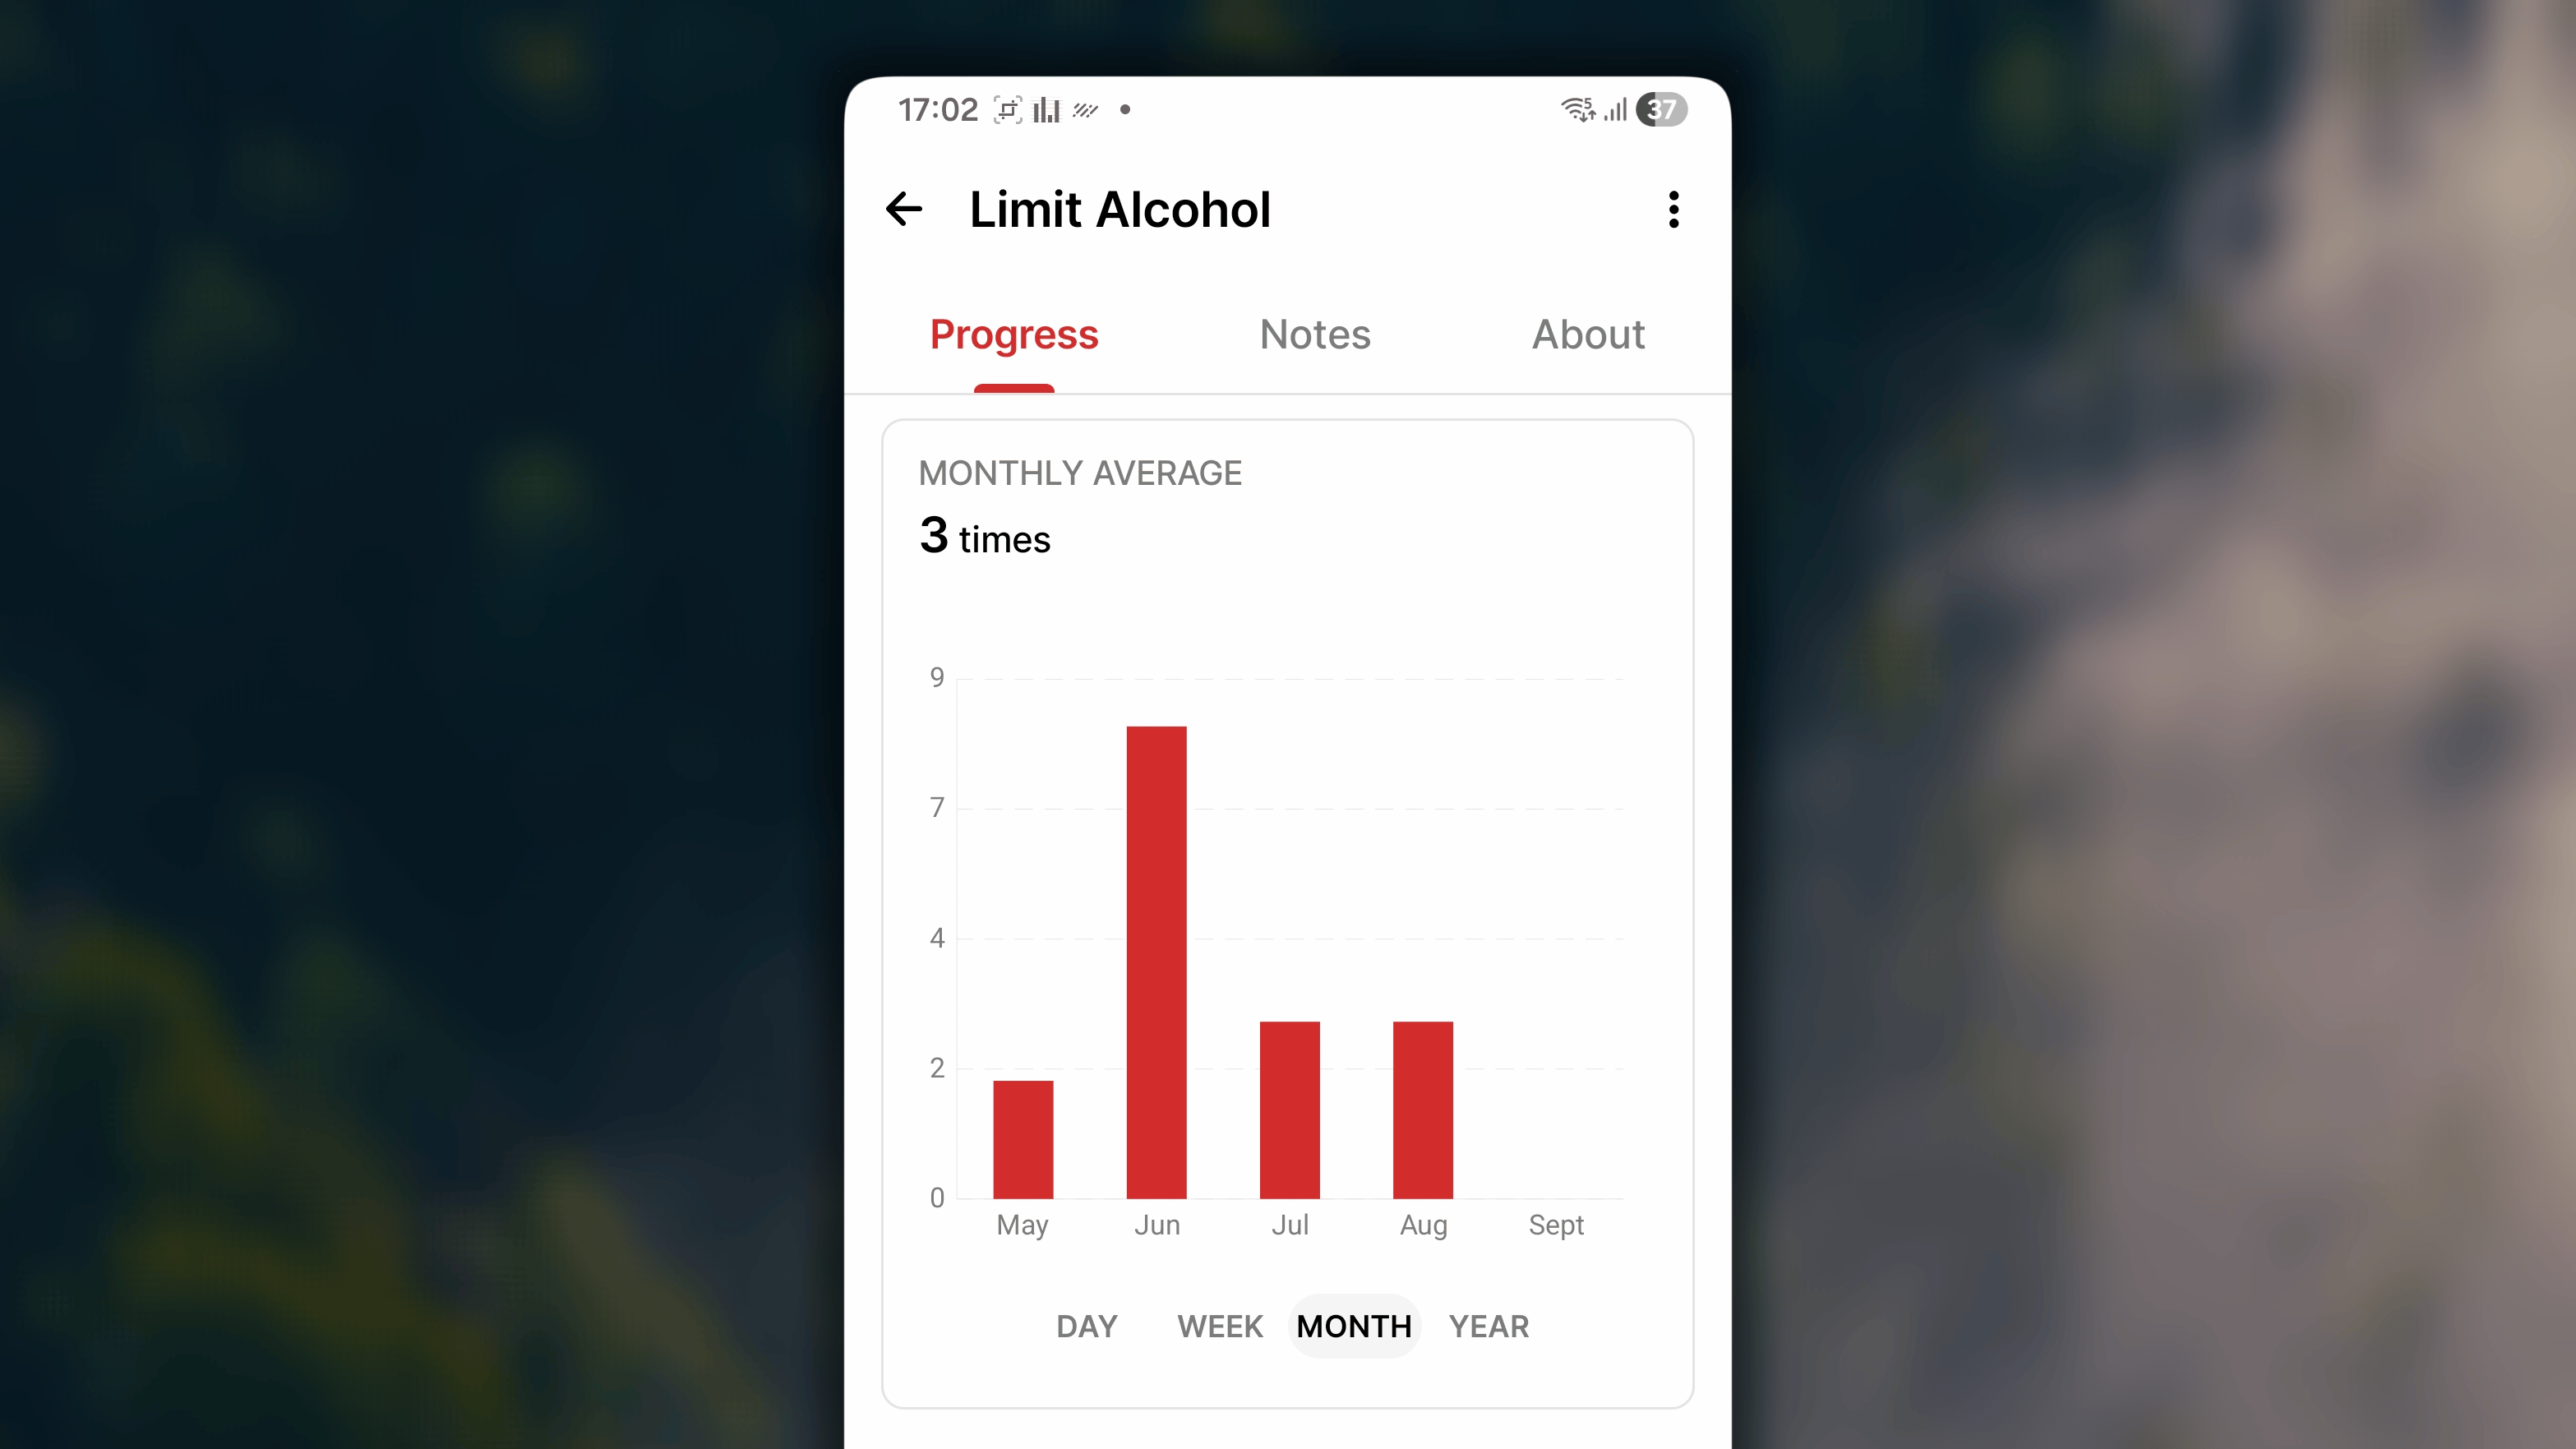
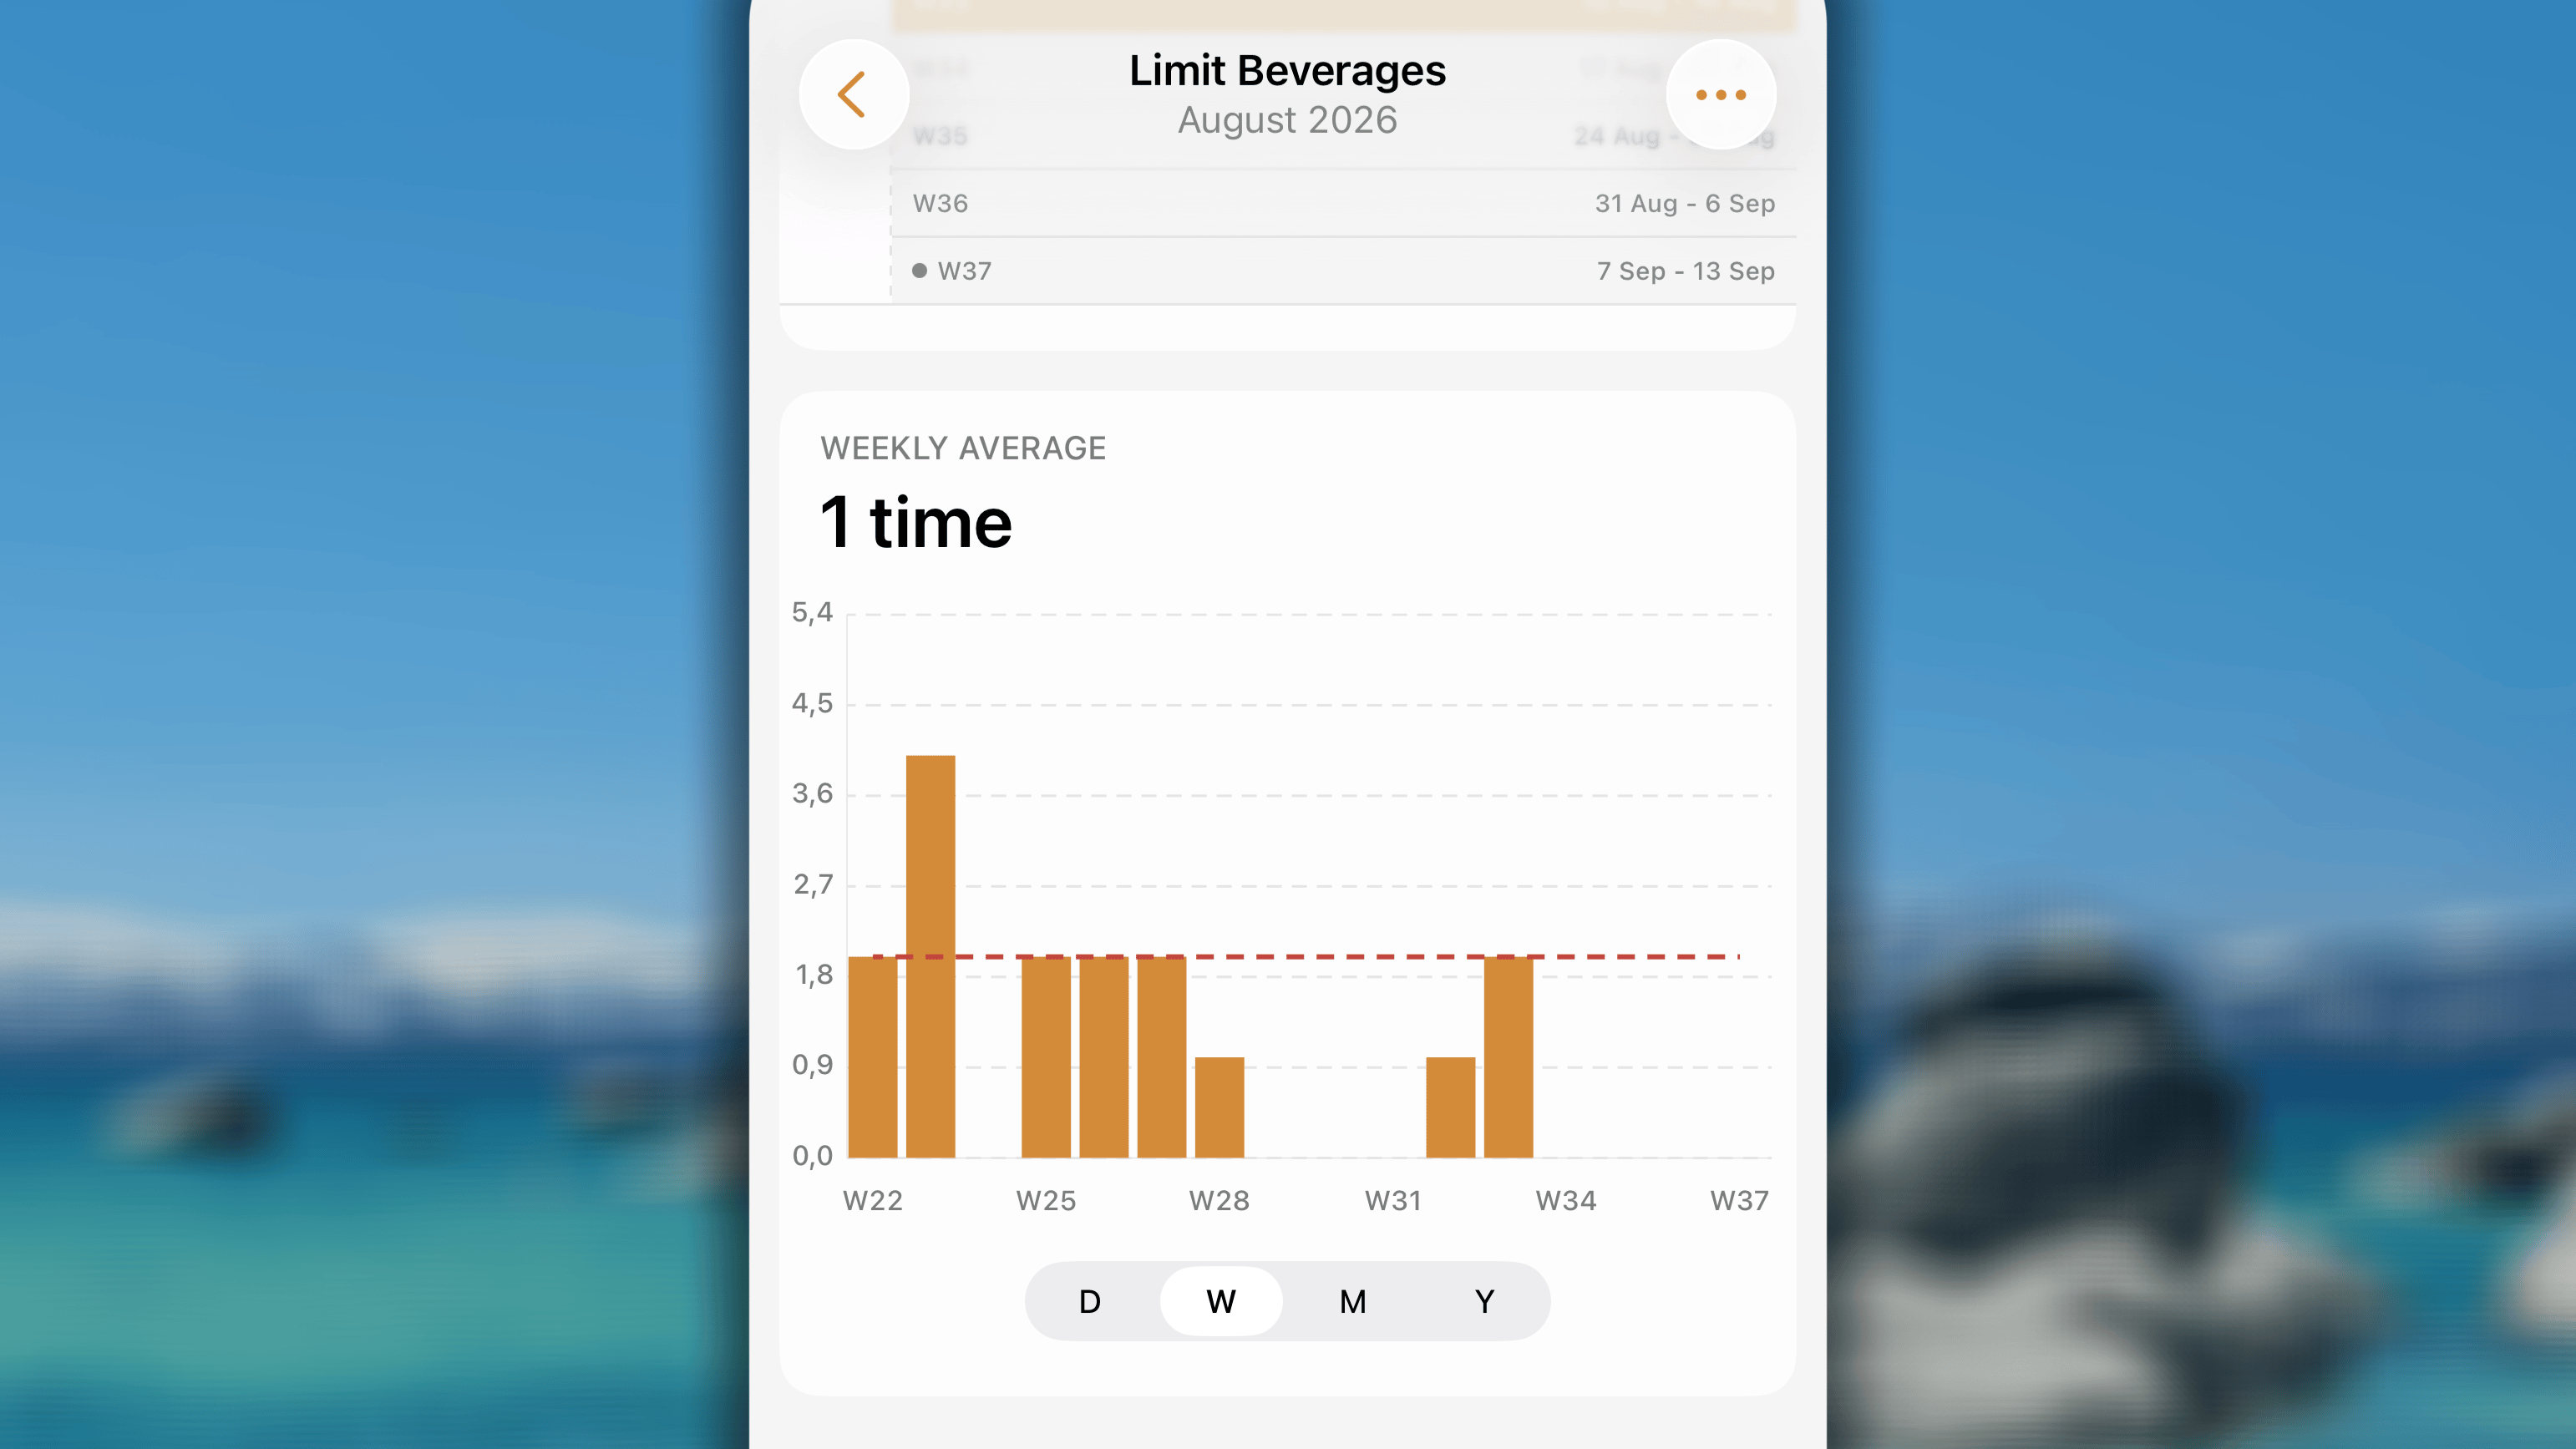
Trending column chart
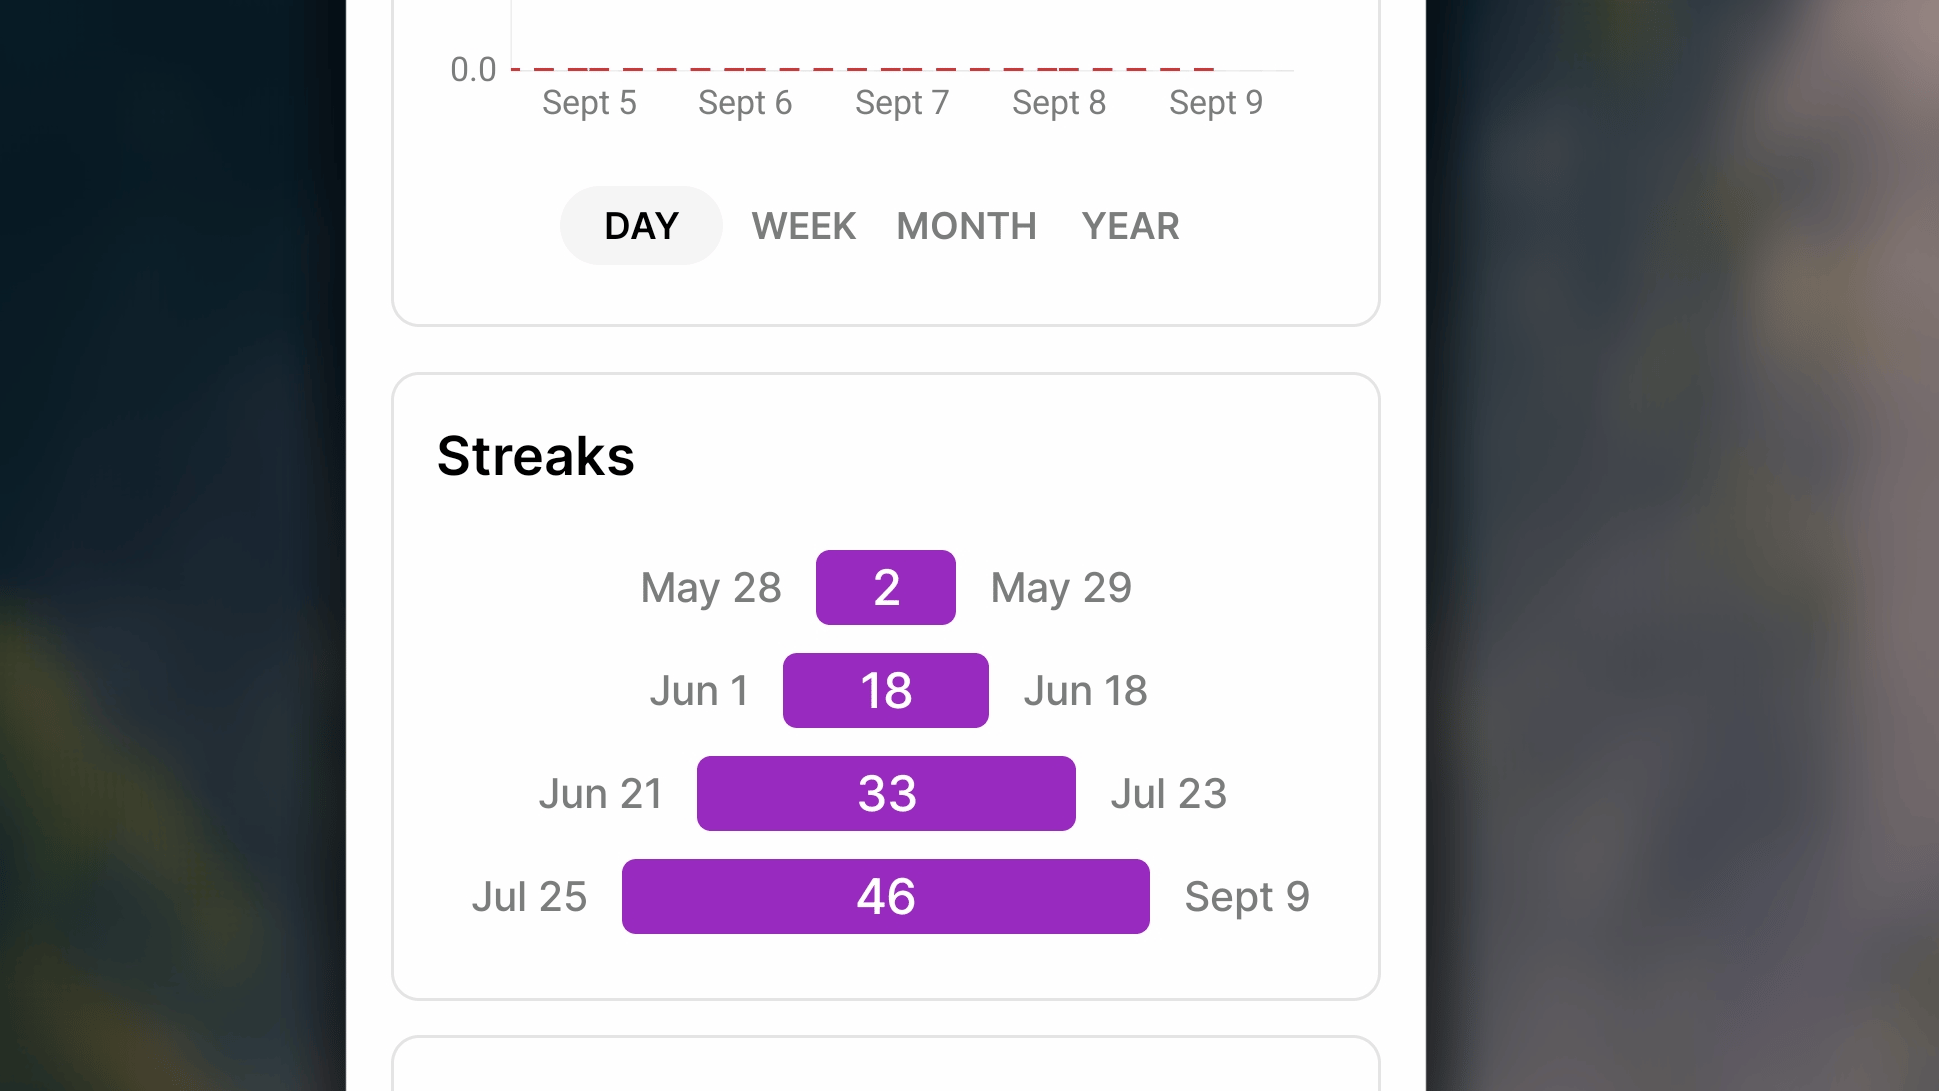
Streak History
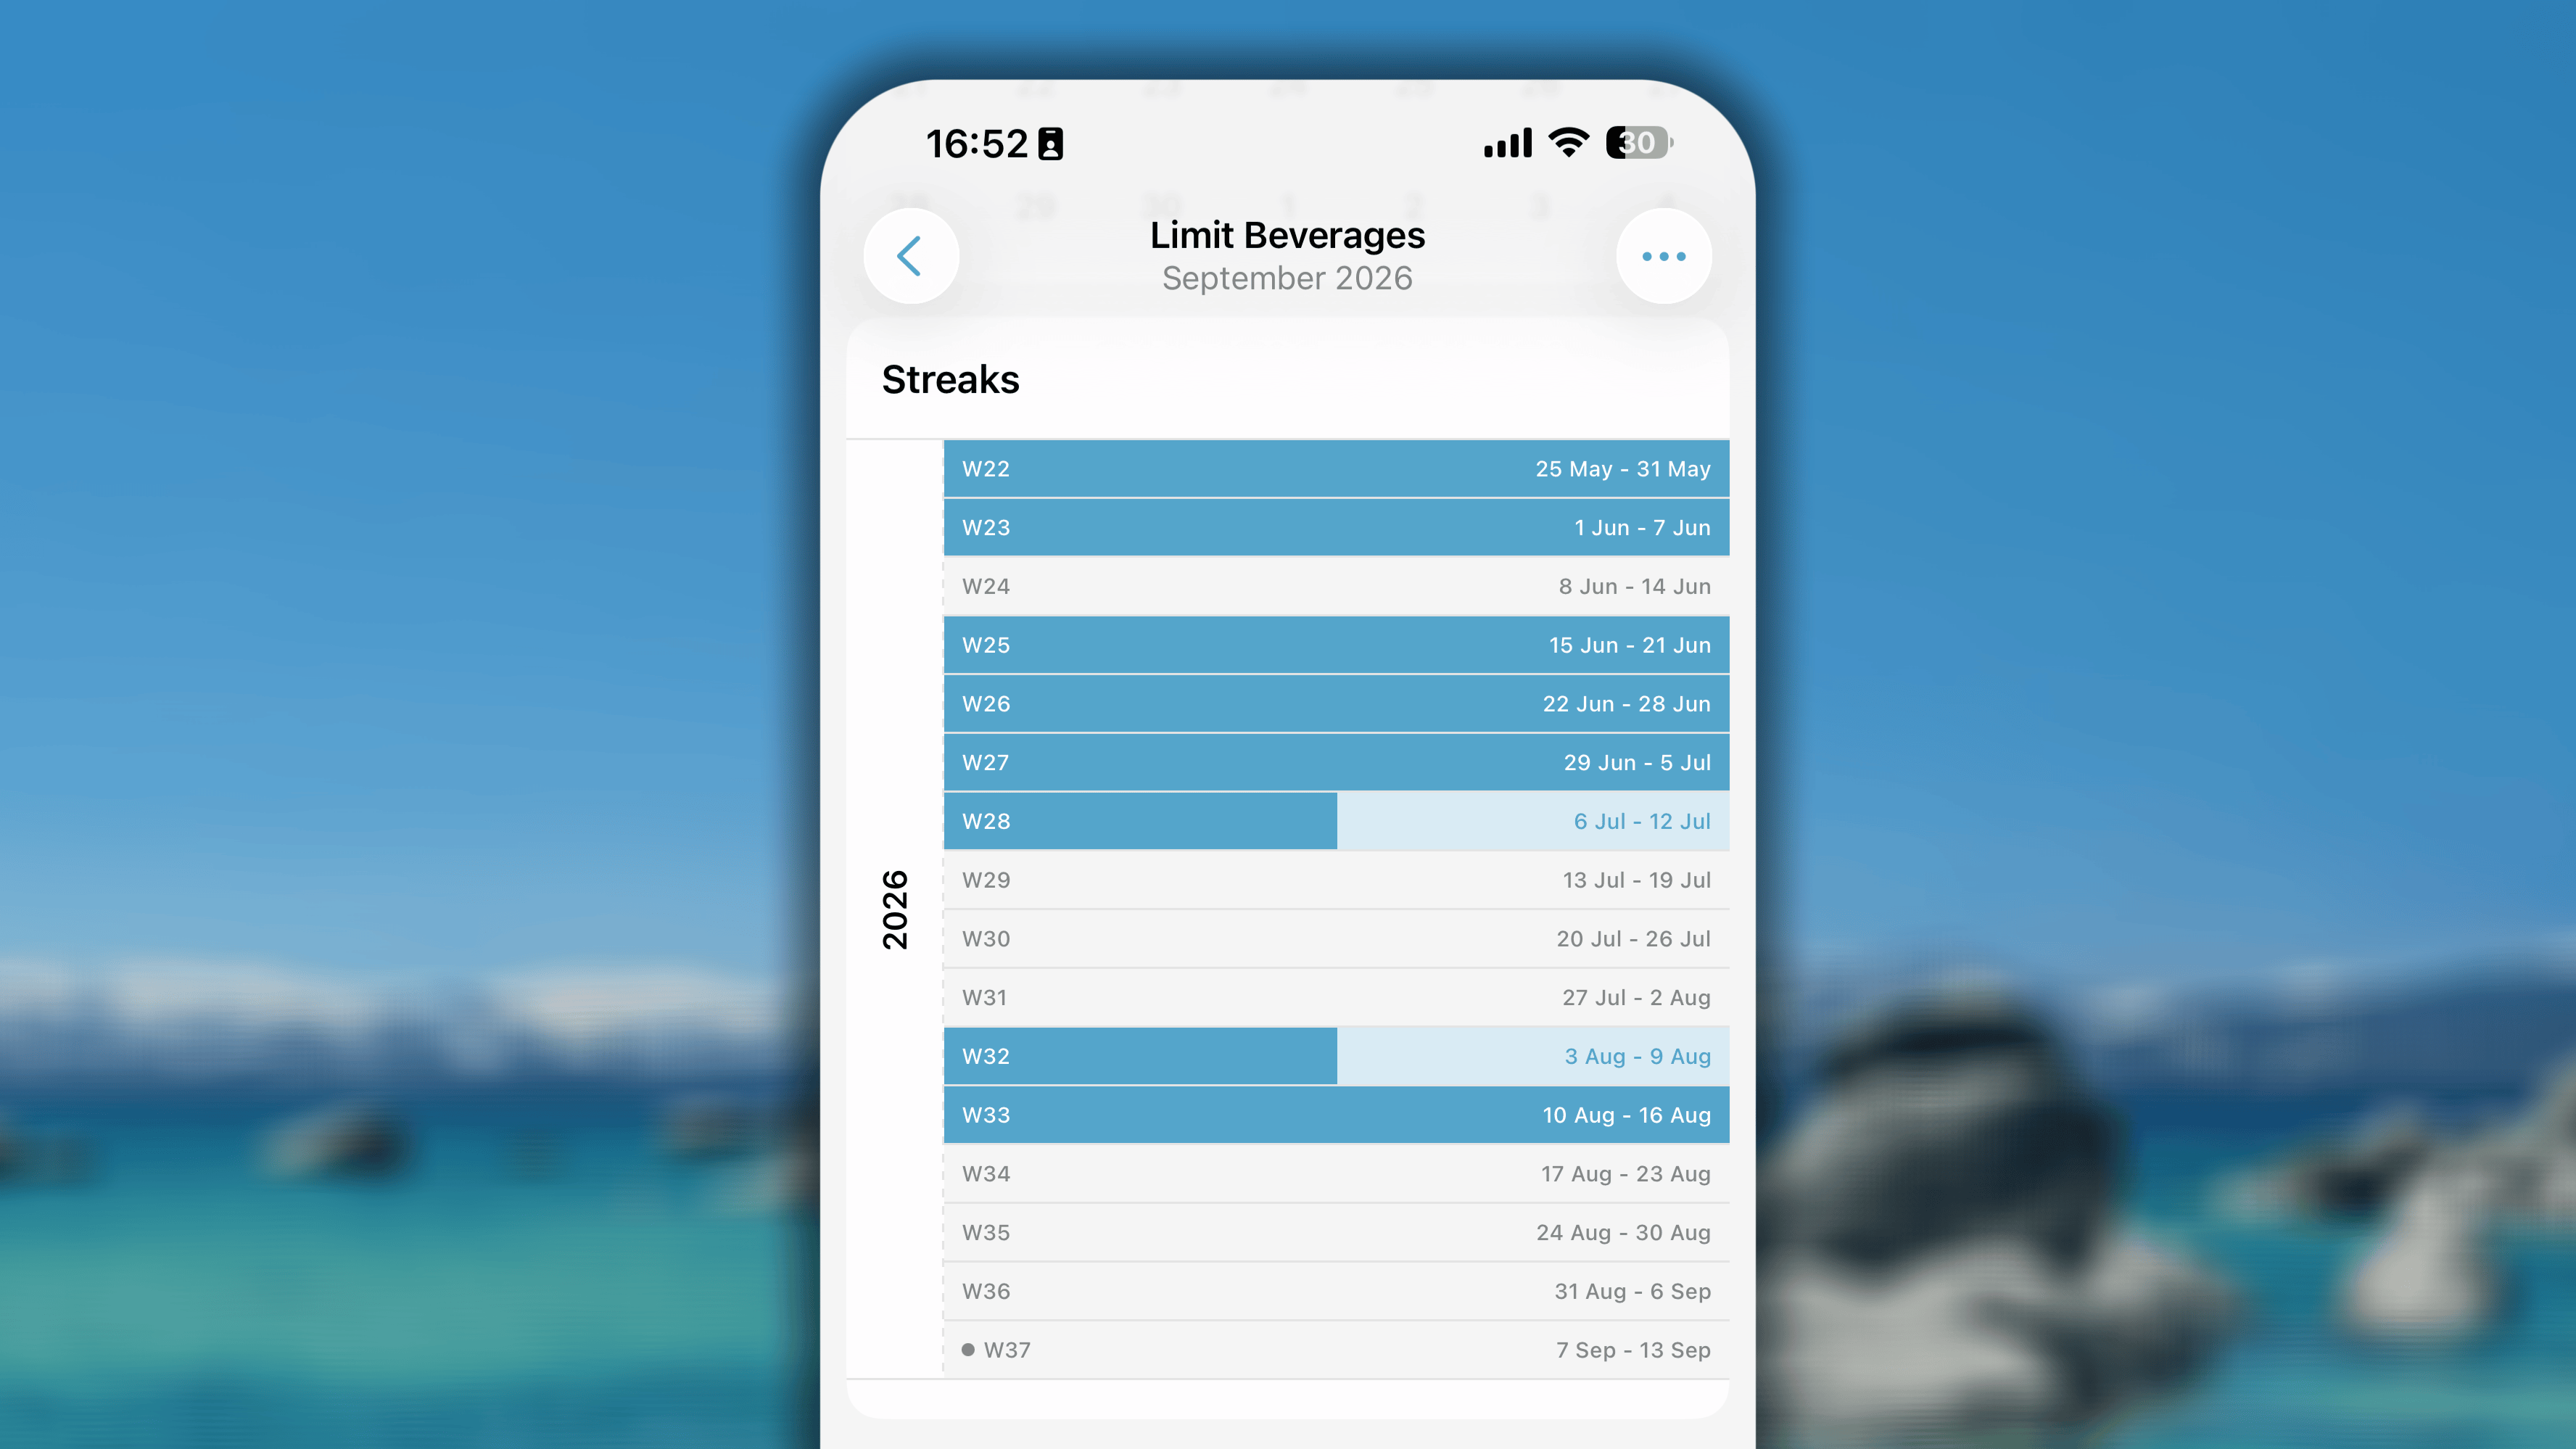
If your habit has a goal to quit, or to limit per day, this section will show you the streaks that you have achieved with your habit, from the first one you got to the most recent one.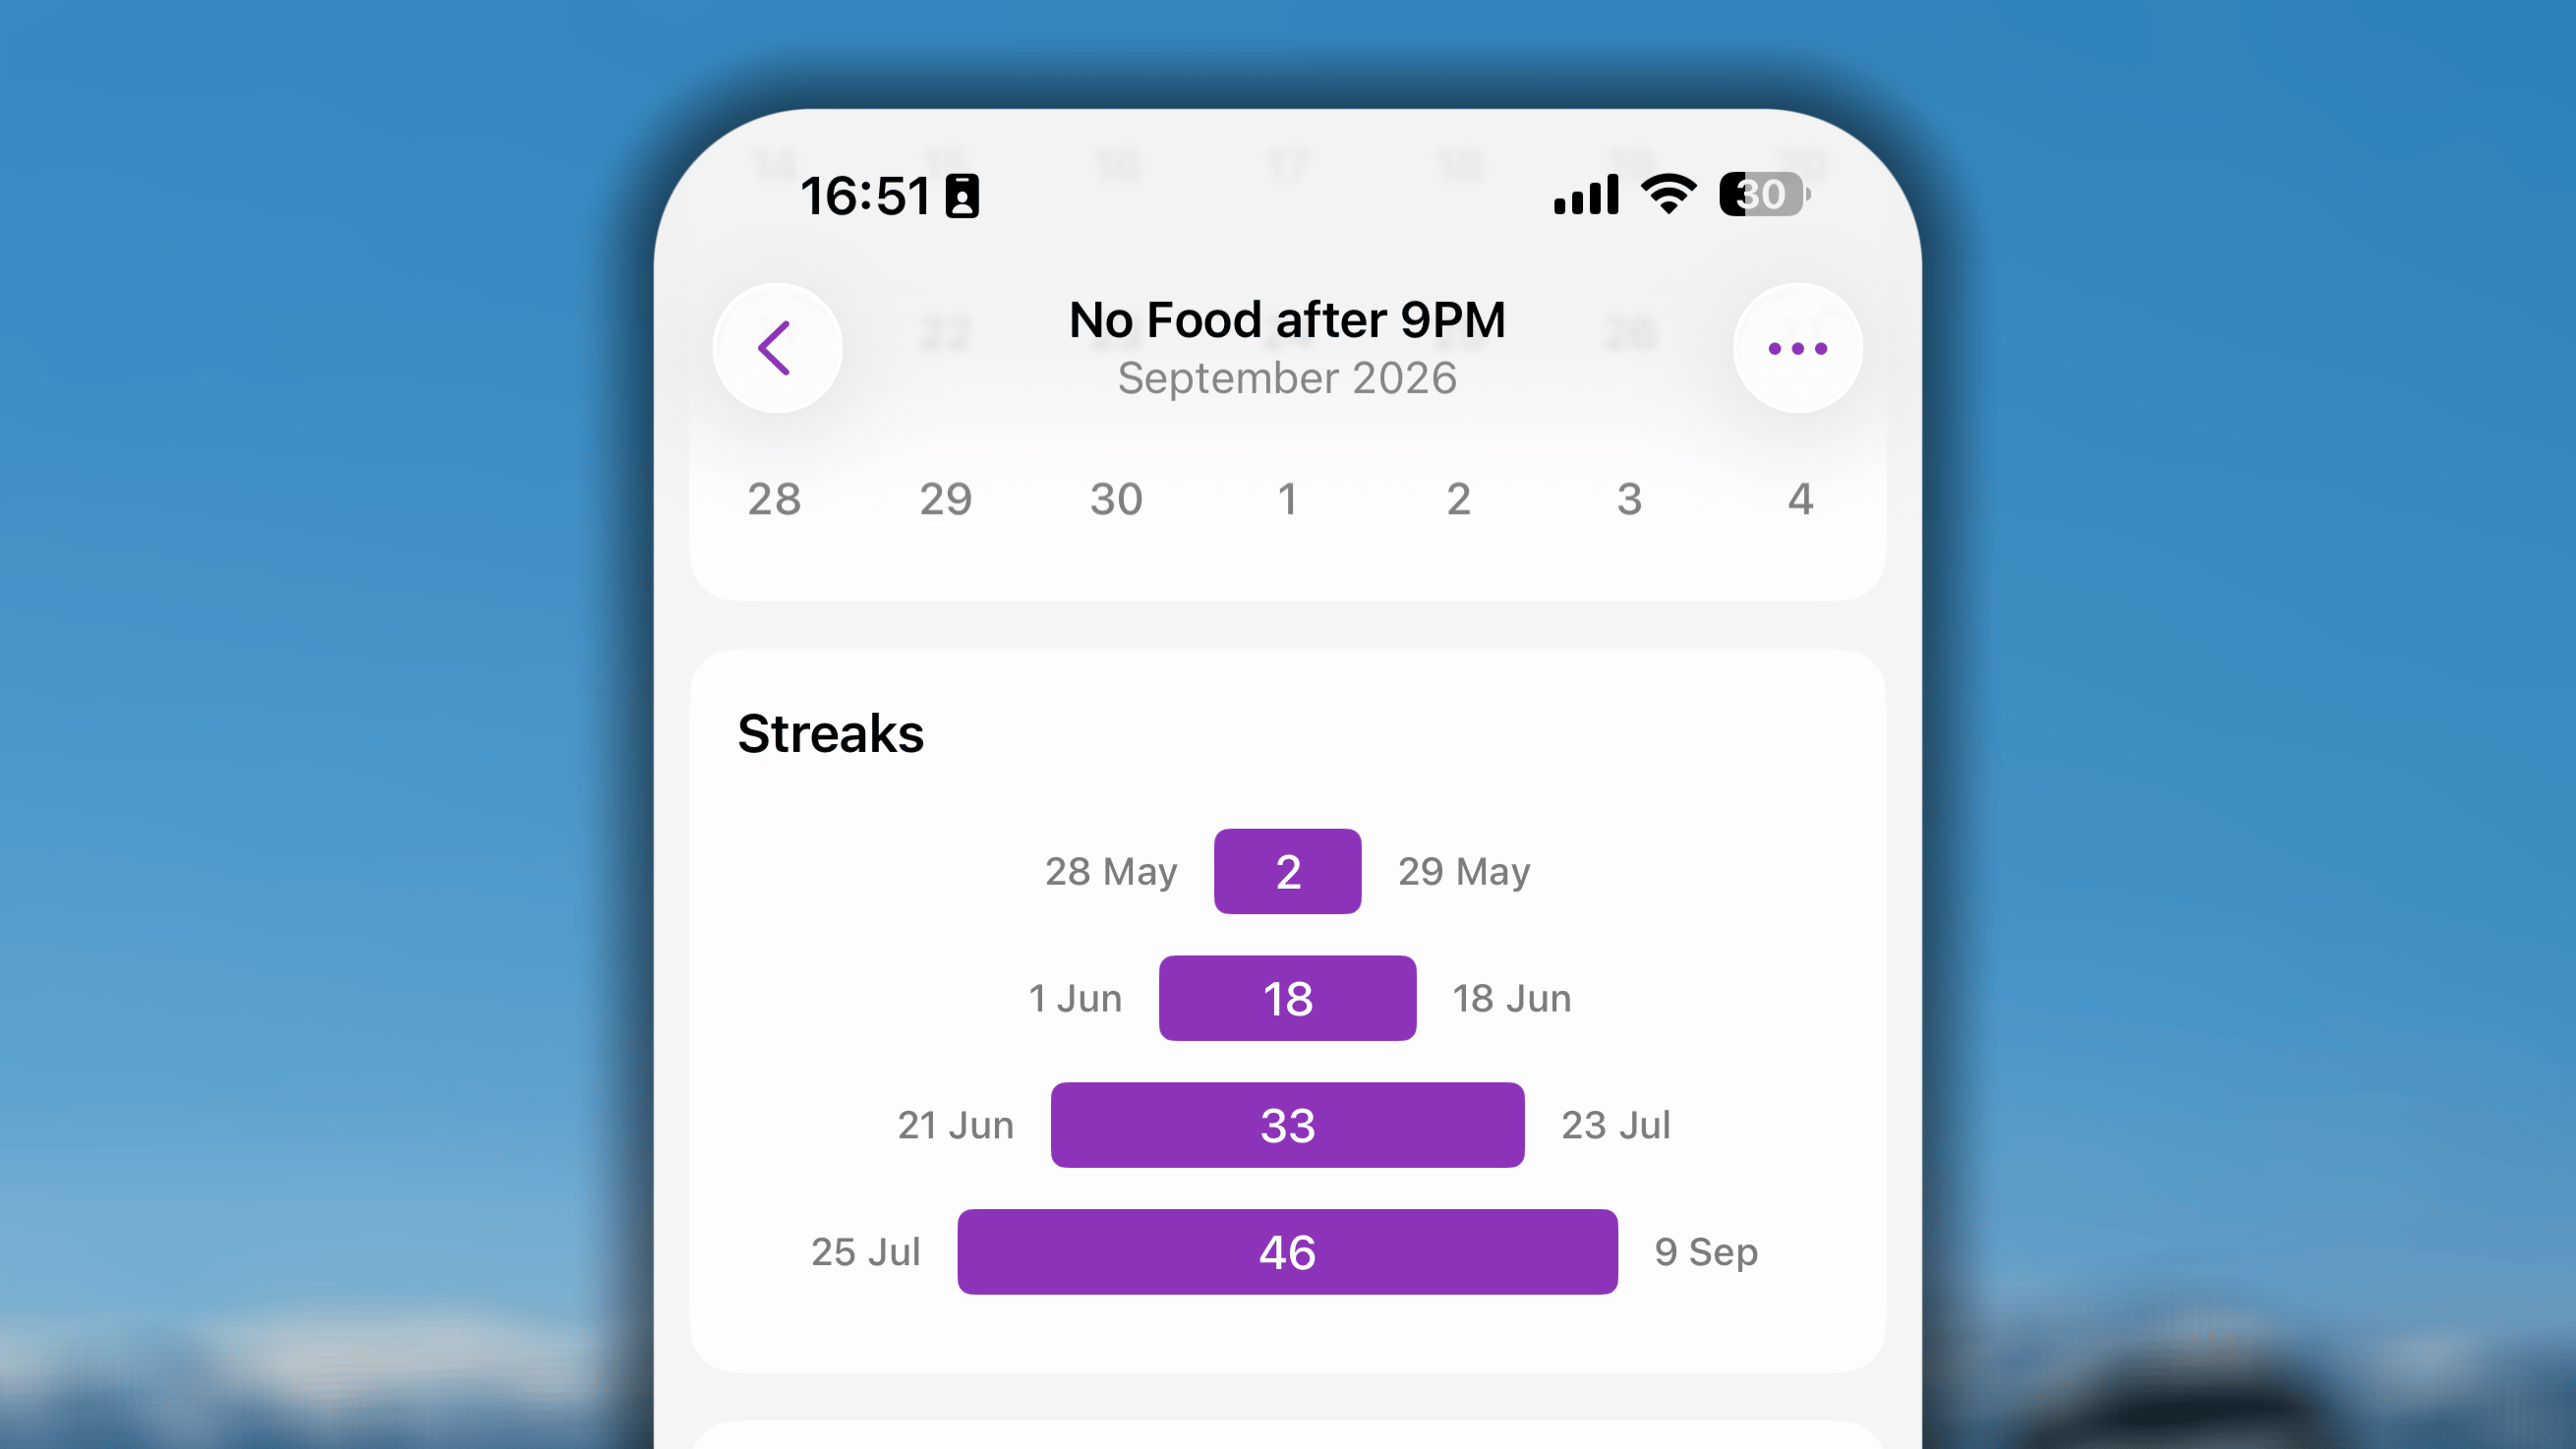
Single Progress on iPhone Duo
When your iPhone Duo is folded, or unfolded and held vertically, the Single Progress view looks the same as it does on a standard iPhone.Below is a a short video for the preview of a habit’s Single Progress on iPhone duo:The difference shows up when you unfold the device and hold it horizontally. The calendar now shows two months side by side: the month you selected on the right, and the month before it on the left. This lets you compare your recent progress at a glance without switching months back and forth.The rest of the elements are rearranged to take advantage of the wider space. The Success, Failed, Skipped, and Total cards spread across the top, and the other sections sit alongside the calendar instead of stacking below it, so you can see more of your habit’s progress on one screen.